
Infograph.me vs BioRender: Scientific Figure Tool Comparison
A practical comparison of Infograph.me and BioRender for scientific figures and research visuals.
A practical comparison of Infograph.me and BioRender for scientific figures and research visuals.
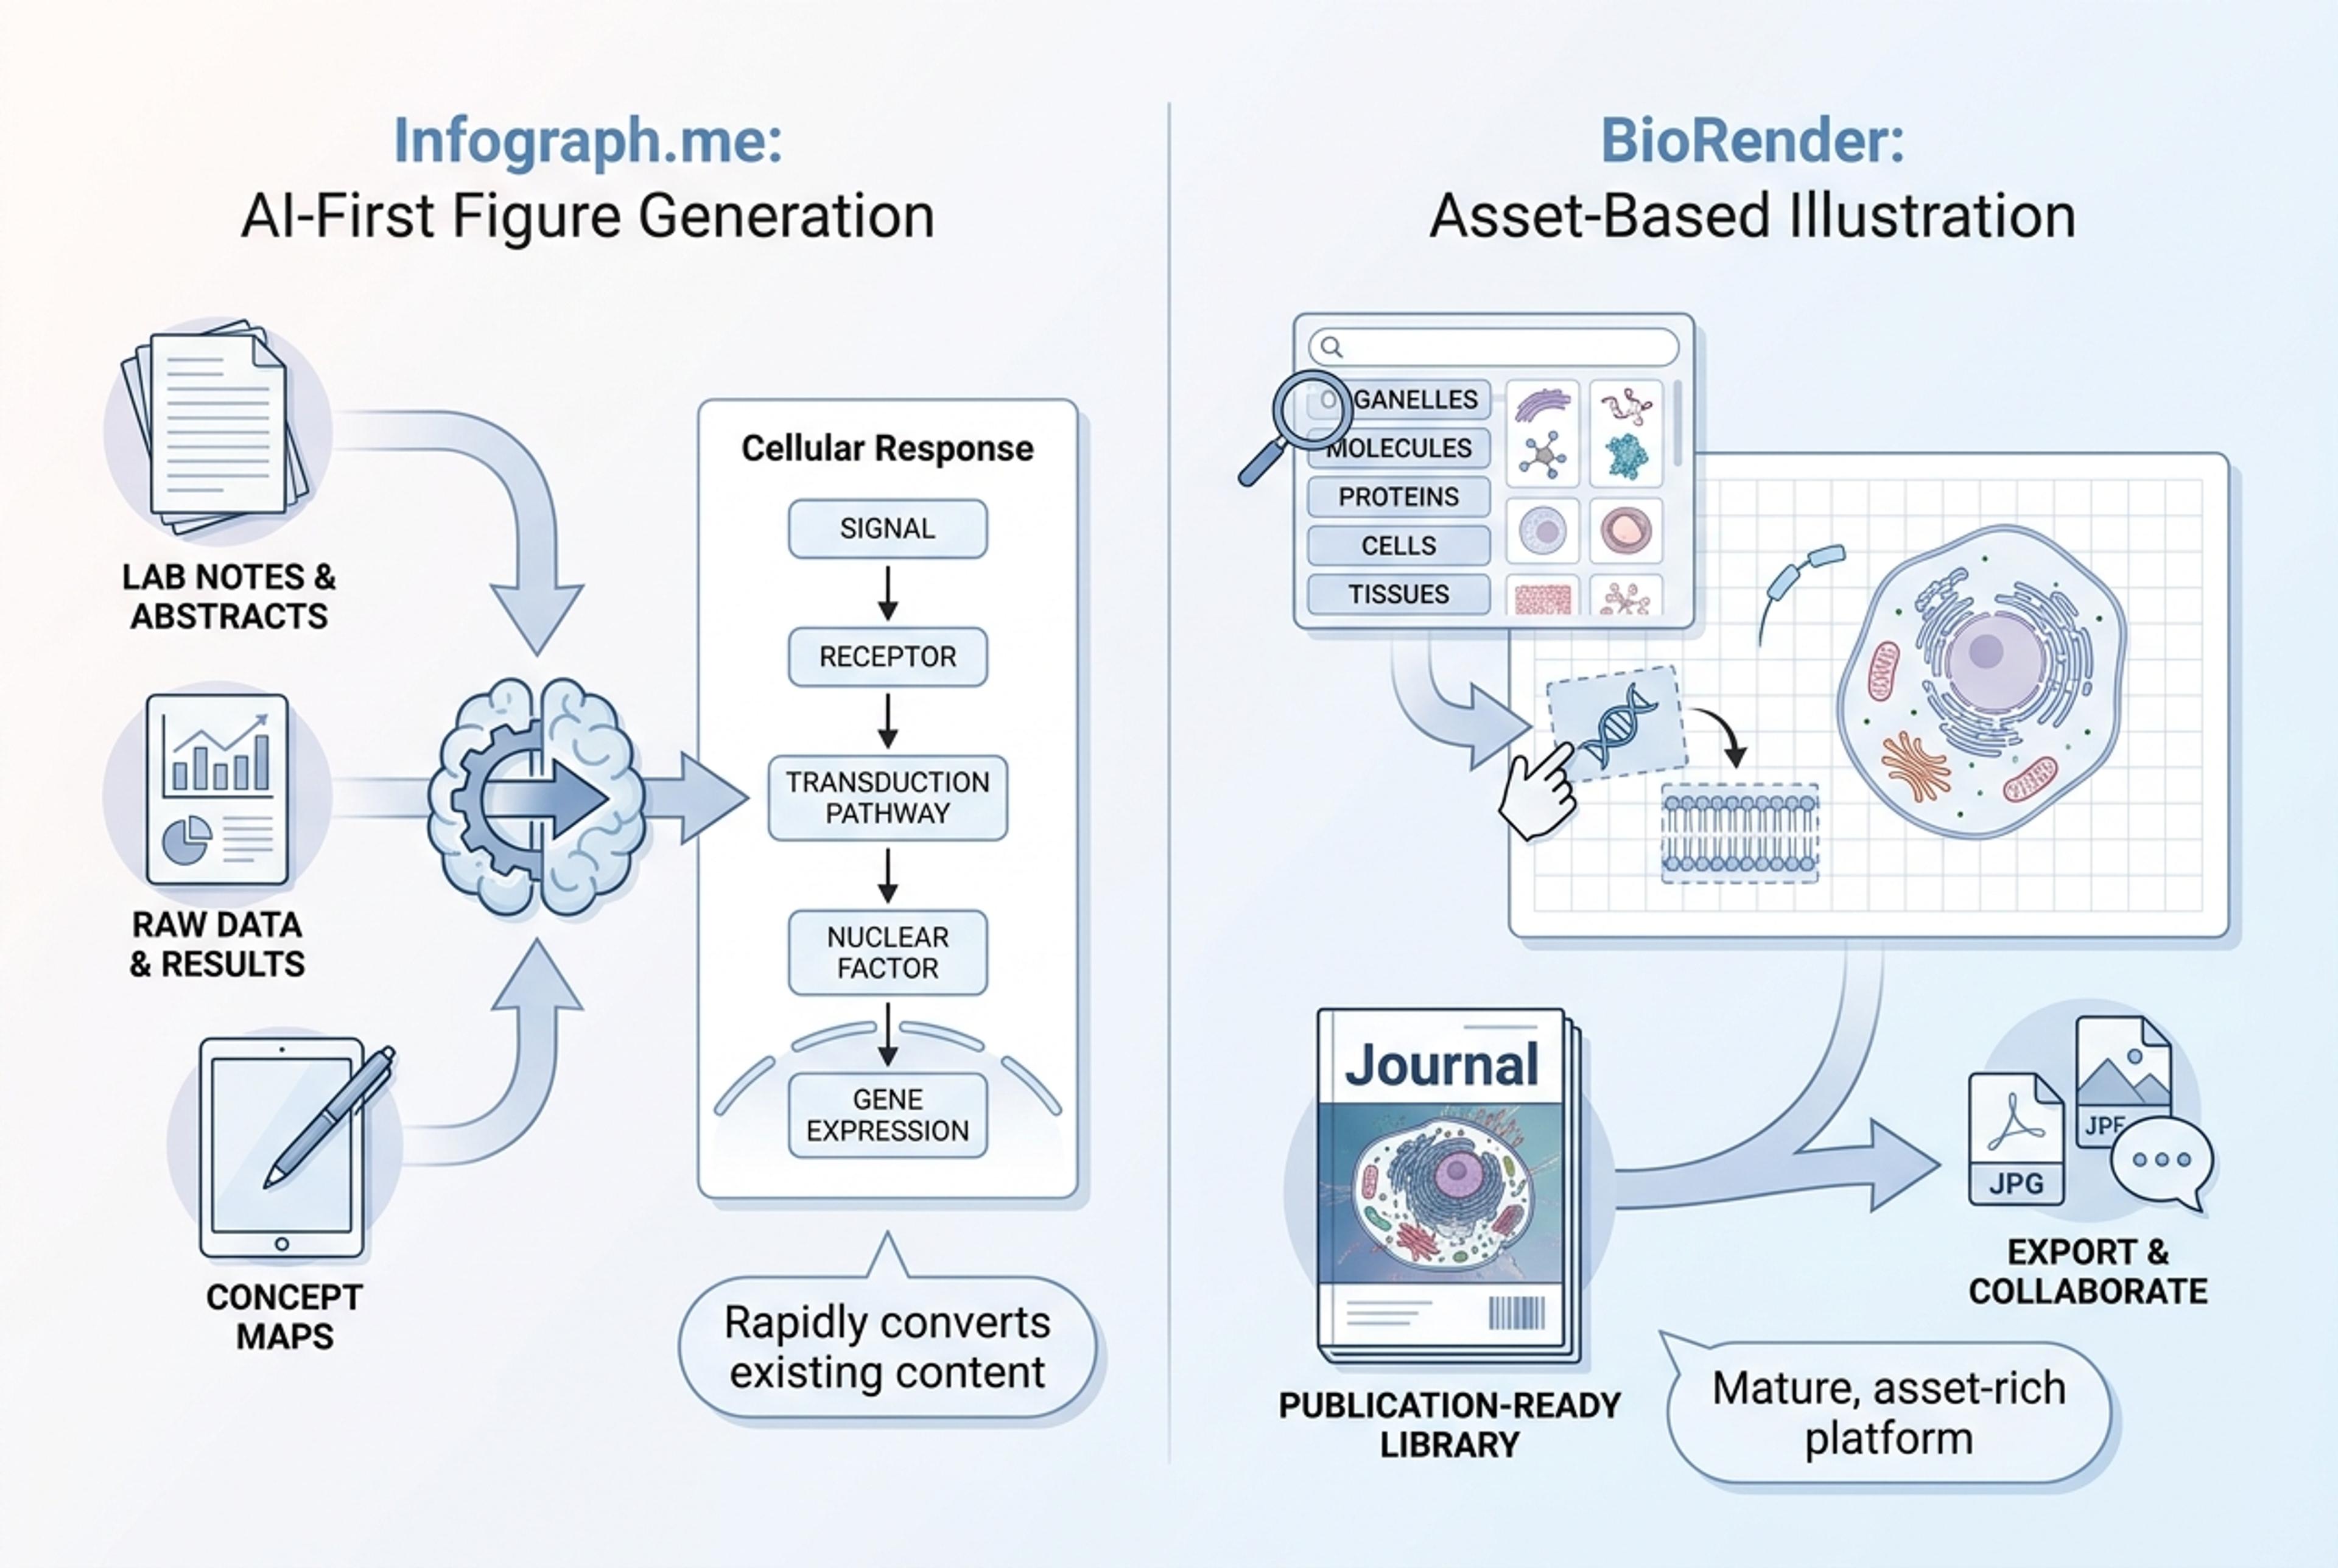
Infograph.me and BioRender both help people create science visuals, but they start from different assumptions.
Choose Infograph.me if you want an AI-first workflow for turning lab notes, paper abstracts, methods, data, links, or lesson material into scientific figures, graphical abstracts, research infographics, biology diagrams, timelines, flowcharts, Venn diagrams, and concept maps.
Choose BioRender if you want a mature scientific illustration platform with a large asset library, a manual figure-building workflow, publication-focused licensing, and team plans for labs or institutions.
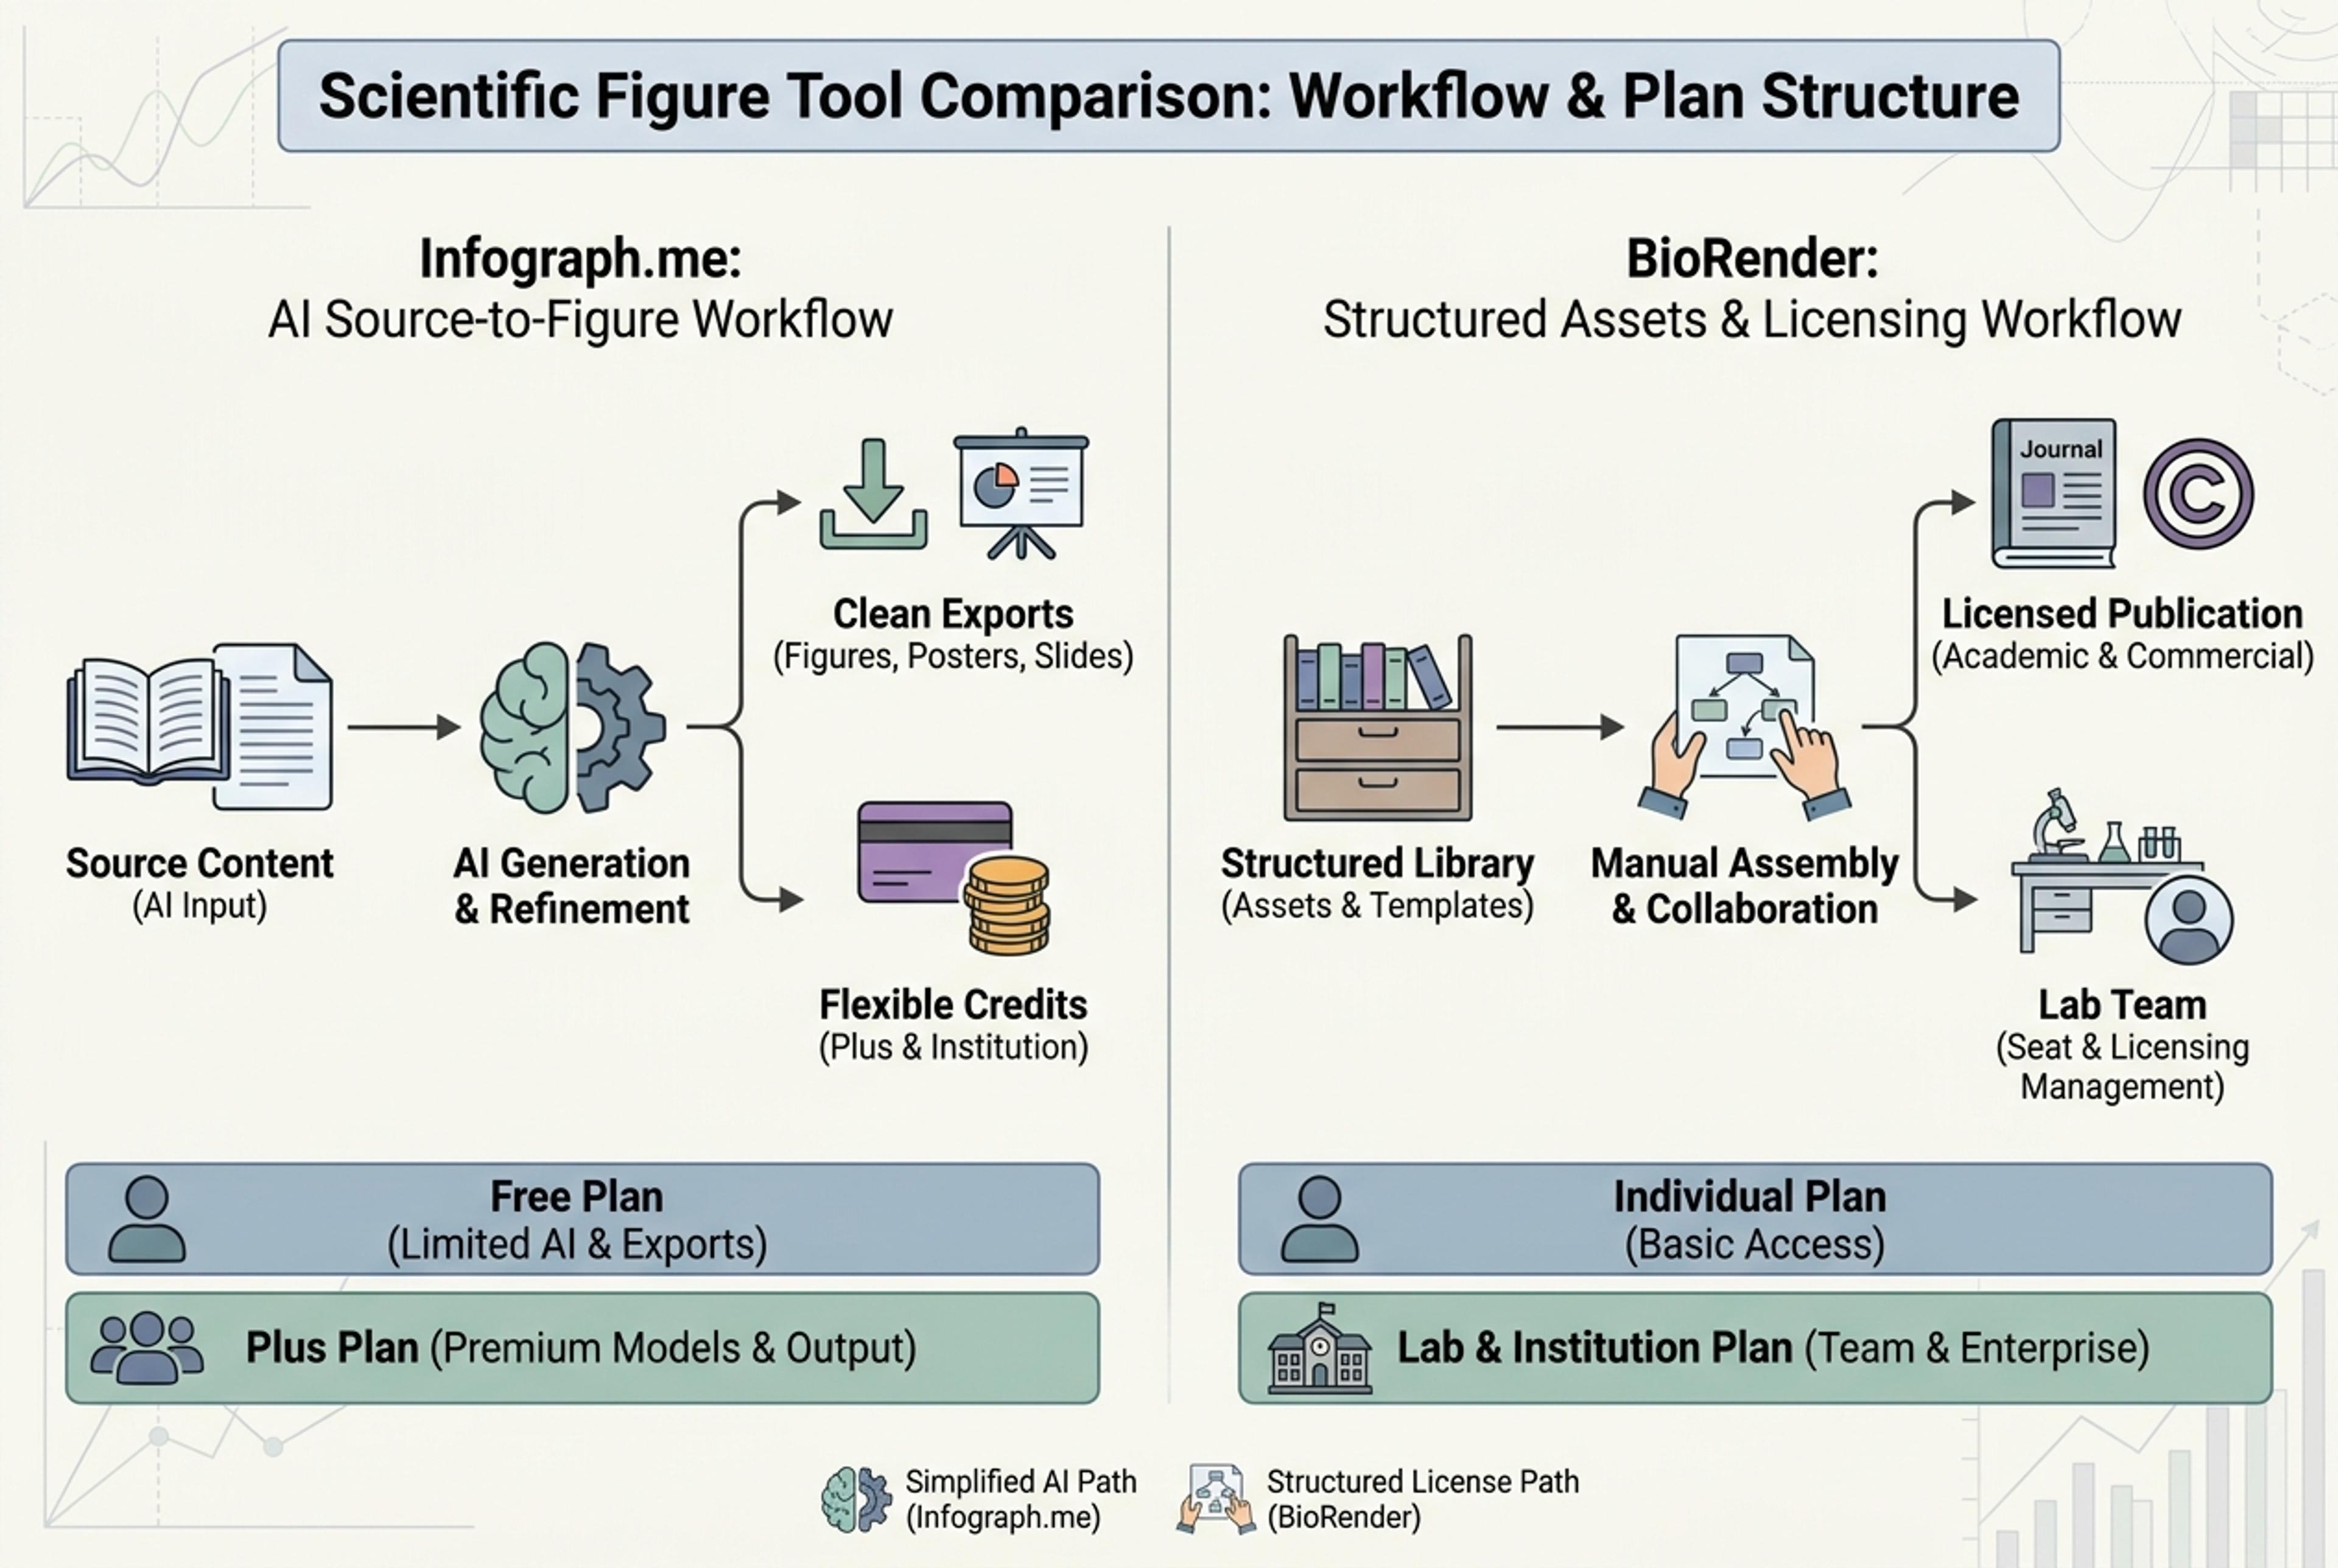
Pricing changes, so check each official pricing page before buying. Based on the pricing screens reviewed on 2026-07-01, the practical comparison looks like this:
| Plan area | Infograph.me | BioRender Academic | BioRender Industry |
|---|---|---|---|
| Free plan | Free is $0: limited credits for AI features, basic image models, up to 2K resolution, and import from PDF, Word, PPTX, links, and text | Free, create up to 3 figures and 1 graphing file; no commercial use or publication | Free, create up to 3 figures and 1 graphing file; no commercial use or publication |
| Individual paid plan | Plus is $12/month billed monthly, or $9/month billed yearly at $108/year; includes 300 credits, premium image models, 4K output, PNG/JPG/PDF and Editable PPT download, no Infograph.me branding, and a 3-day money-back guarantee | Individual is $35/month paid annually, or $39 monthly | Individual is $95/month paid annually, or $115 monthly |
| Team/lab plan | Infograph.me currently shows Free and Plus plans in-app; Plus is the public paid plan for higher AI creation and export capacity | Lab is $99/month for 5 seats paid annually, or $129 monthly; extra seats shown as $20/month | Team is $475/month for 5 seats paid annually, or $570 monthly; extra seats shown as $95/month |
| Institution/enterprise | Contact for high-volume or organization needs | Institution is custom price | Enterprise is custom price |
| Pricing implication | Simpler pricing: Free for testing, Plus for 300 AI credits, premium models, 4K output, and clean exports; BioRender becomes more expensive when academic/lab/industry licensing is the main requirement | Strong when academic publication permission, figure assets, and lab collaboration justify the plan | Much higher entry price for industry teams, but built around commercial and company use cases |
| Decision point | Infograph.me | BioRender |
|---|---|---|
| Primary workflow | Generate scientific figures from source material, then refine with AI | Build scientific figures manually from templates, icons, and visual assets |
| Best fit | Researchers, educators, students, and science communicators who need fast first drafts from papers, notes, data, links, or topics | Researchers, labs, and institutions that need polished scientific illustration assets and publication workflows |
| Source material | Strong fit for lab notes, paper abstracts, lesson material, methods, results, links, tables, and research-heavy text | Stronger fit when you already know the figure you want to compose inside a scientific illustration workspace |
| Scientific coverage | Scientific figures, graphical abstracts, research infographics, biology diagrams, and educational science visuals | Mature biology, biomedical, medical, and scientific illustration workflow |
| General diagrams | Also supports timelines, flowcharts, Venn diagrams, concept maps, and research diagrams | Primarily focused on scientific and biomedical illustration |
| Export and editing | Built around AI drafting, readable hierarchy, and export-ready research visuals | Built around manual figure composition, scientific assets, collaboration, and publication permission |
| Pricing shape | Free at $0; Plus is $12/month monthly or $9/month yearly at $108/year, with 300 credits, premium image models, 4K output, PNG/JPG/PDF and Editable PPT export | Free plan is limited; paid academic individual starts at $35/month annually, lab at $99/month for 5 seats annually |
Infograph.me is strongest when the hard part is getting from source material to a visual structure. Instead of starting with a blank canvas, you can bring in the research or lesson content first and let AI create the first visual draft.
BioRender may be the better fit when you already want its specific design workflow, library, or ecosystem.
Use Infograph.me when your question is: "How do I turn this paper, note, lesson, data, or topic into a clear scientific visual quickly?"
Use BioRender when your question is: "How do I build a polished scientific illustration inside an established scientific asset and publication workflow?"
Infograph.me is being rebuilt around AI scientific figures and research visuals. General infographic formats still matter, but they support the main positioning: scientific figures, graphical abstracts, biology diagrams, education visuals, and research infographics.
BioRender remains a strong choice for teams that want a mature scientific illustration workspace and are comfortable with its academic, lab, institution, or industry pricing model.
This comparison is based on the public positioning of Infograph.me, BioRender, and the BioRender pricing screens reviewed on 2026-07-01. Product features and pricing can change, so check official product pages before making a final decision.
Turn research notes, methods, data, and science topics into labeled scientific figure drafts with AI.
Generate clear scientific illustrations, concept diagrams, and explanation visuals from text, papers, links, and topics.
Create graphical abstract drafts from papers, abstracts, methods, findings, and research notes.
Turn research findings, methods, literature notes, and data into clear academic infographics.
Generate biology diagrams from topics, notes, papers, links, and classroom material with AI.
Turn notes, papers, lesson plans, and topics into concept maps that show ideas, links, hierarchy, and relationships.
Turn papers, lab notes, links, text, and data into scientific figures, graphical abstracts, biology diagrams, and research visuals. AI Scientific Figure Maker | Built for research and education