

Science concepts
Compare biological systems, methods, theories, or phenomena with labeled overlap.
Create Venn diagrams from concepts, notes, papers, lesson material, comparisons, and research themes.
Drag and drop your paper, lab notes, lesson material, or document here or
Use Venn diagrams to show shared traits, differences, categories, and evidence patterns.
Compare biological systems, methods, theories, or phenomena with labeled overlap.
Create student-friendly comparison visuals for reading, science, and social studies.
Show where literatures, findings, methods, or populations overlap and differ.
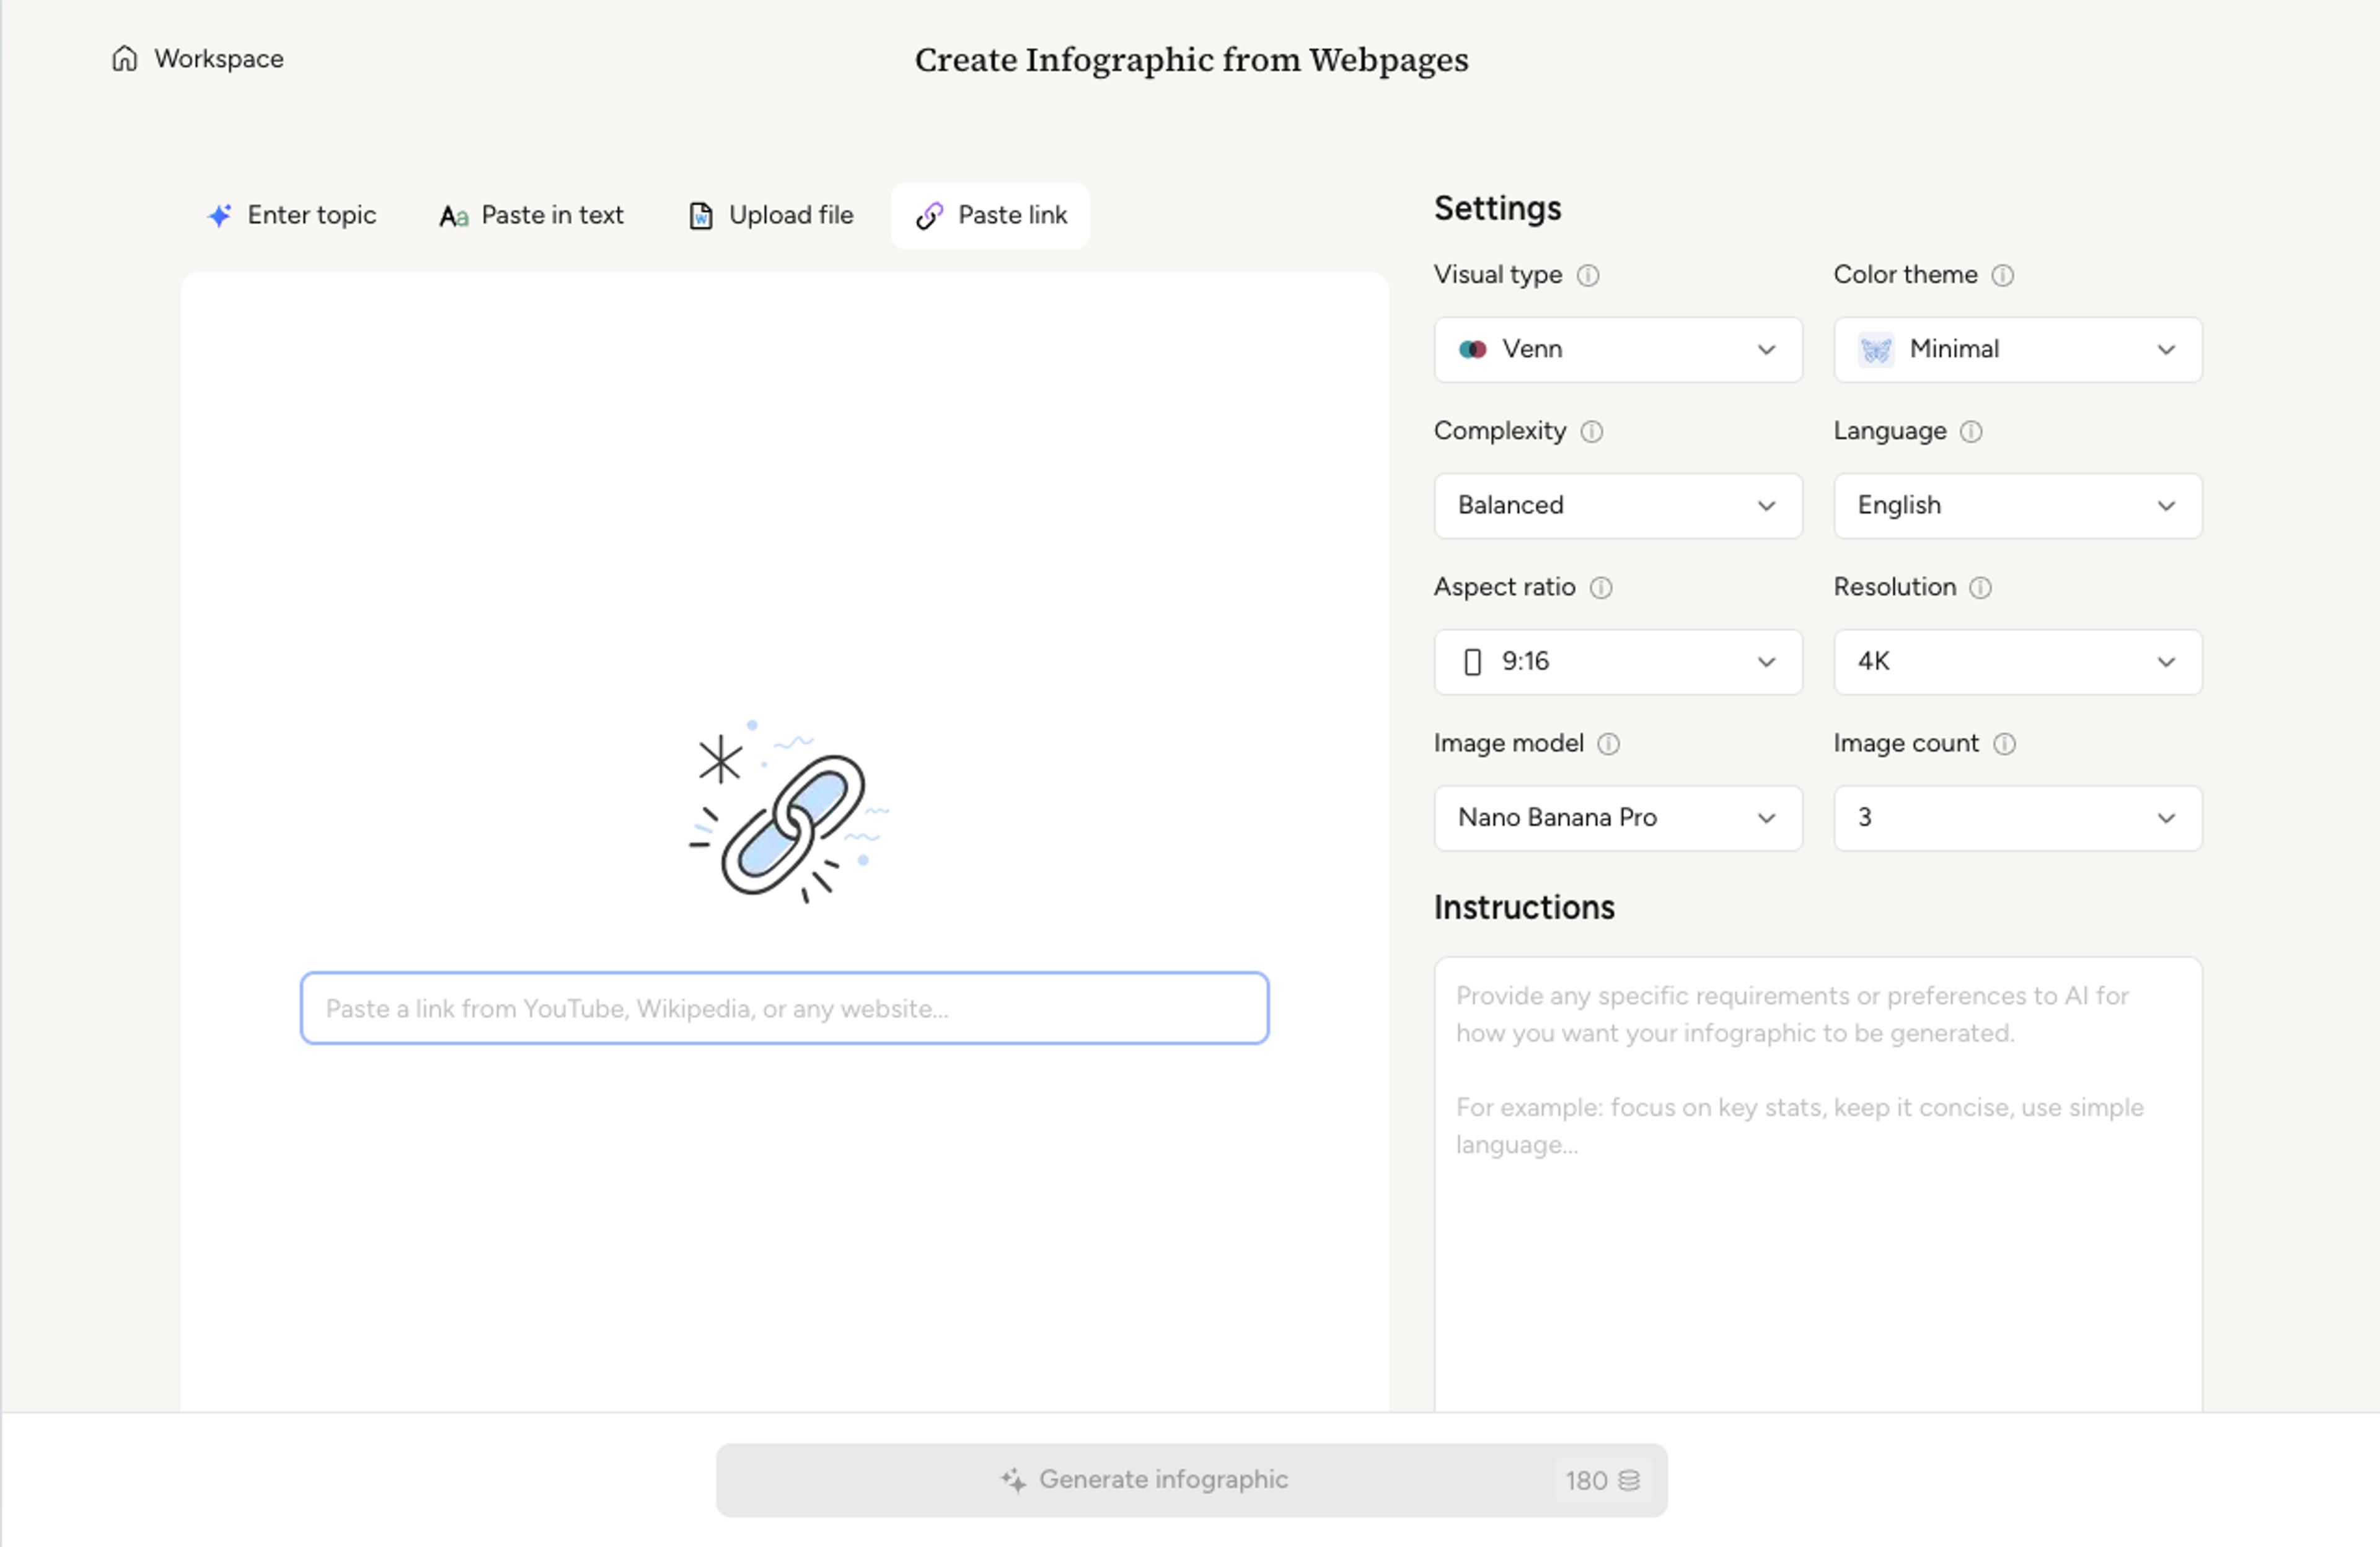
Paste notes, upload a paper, add a link, or describe the venn diagram maker you need. Infograph reads the context before it designs the visual.
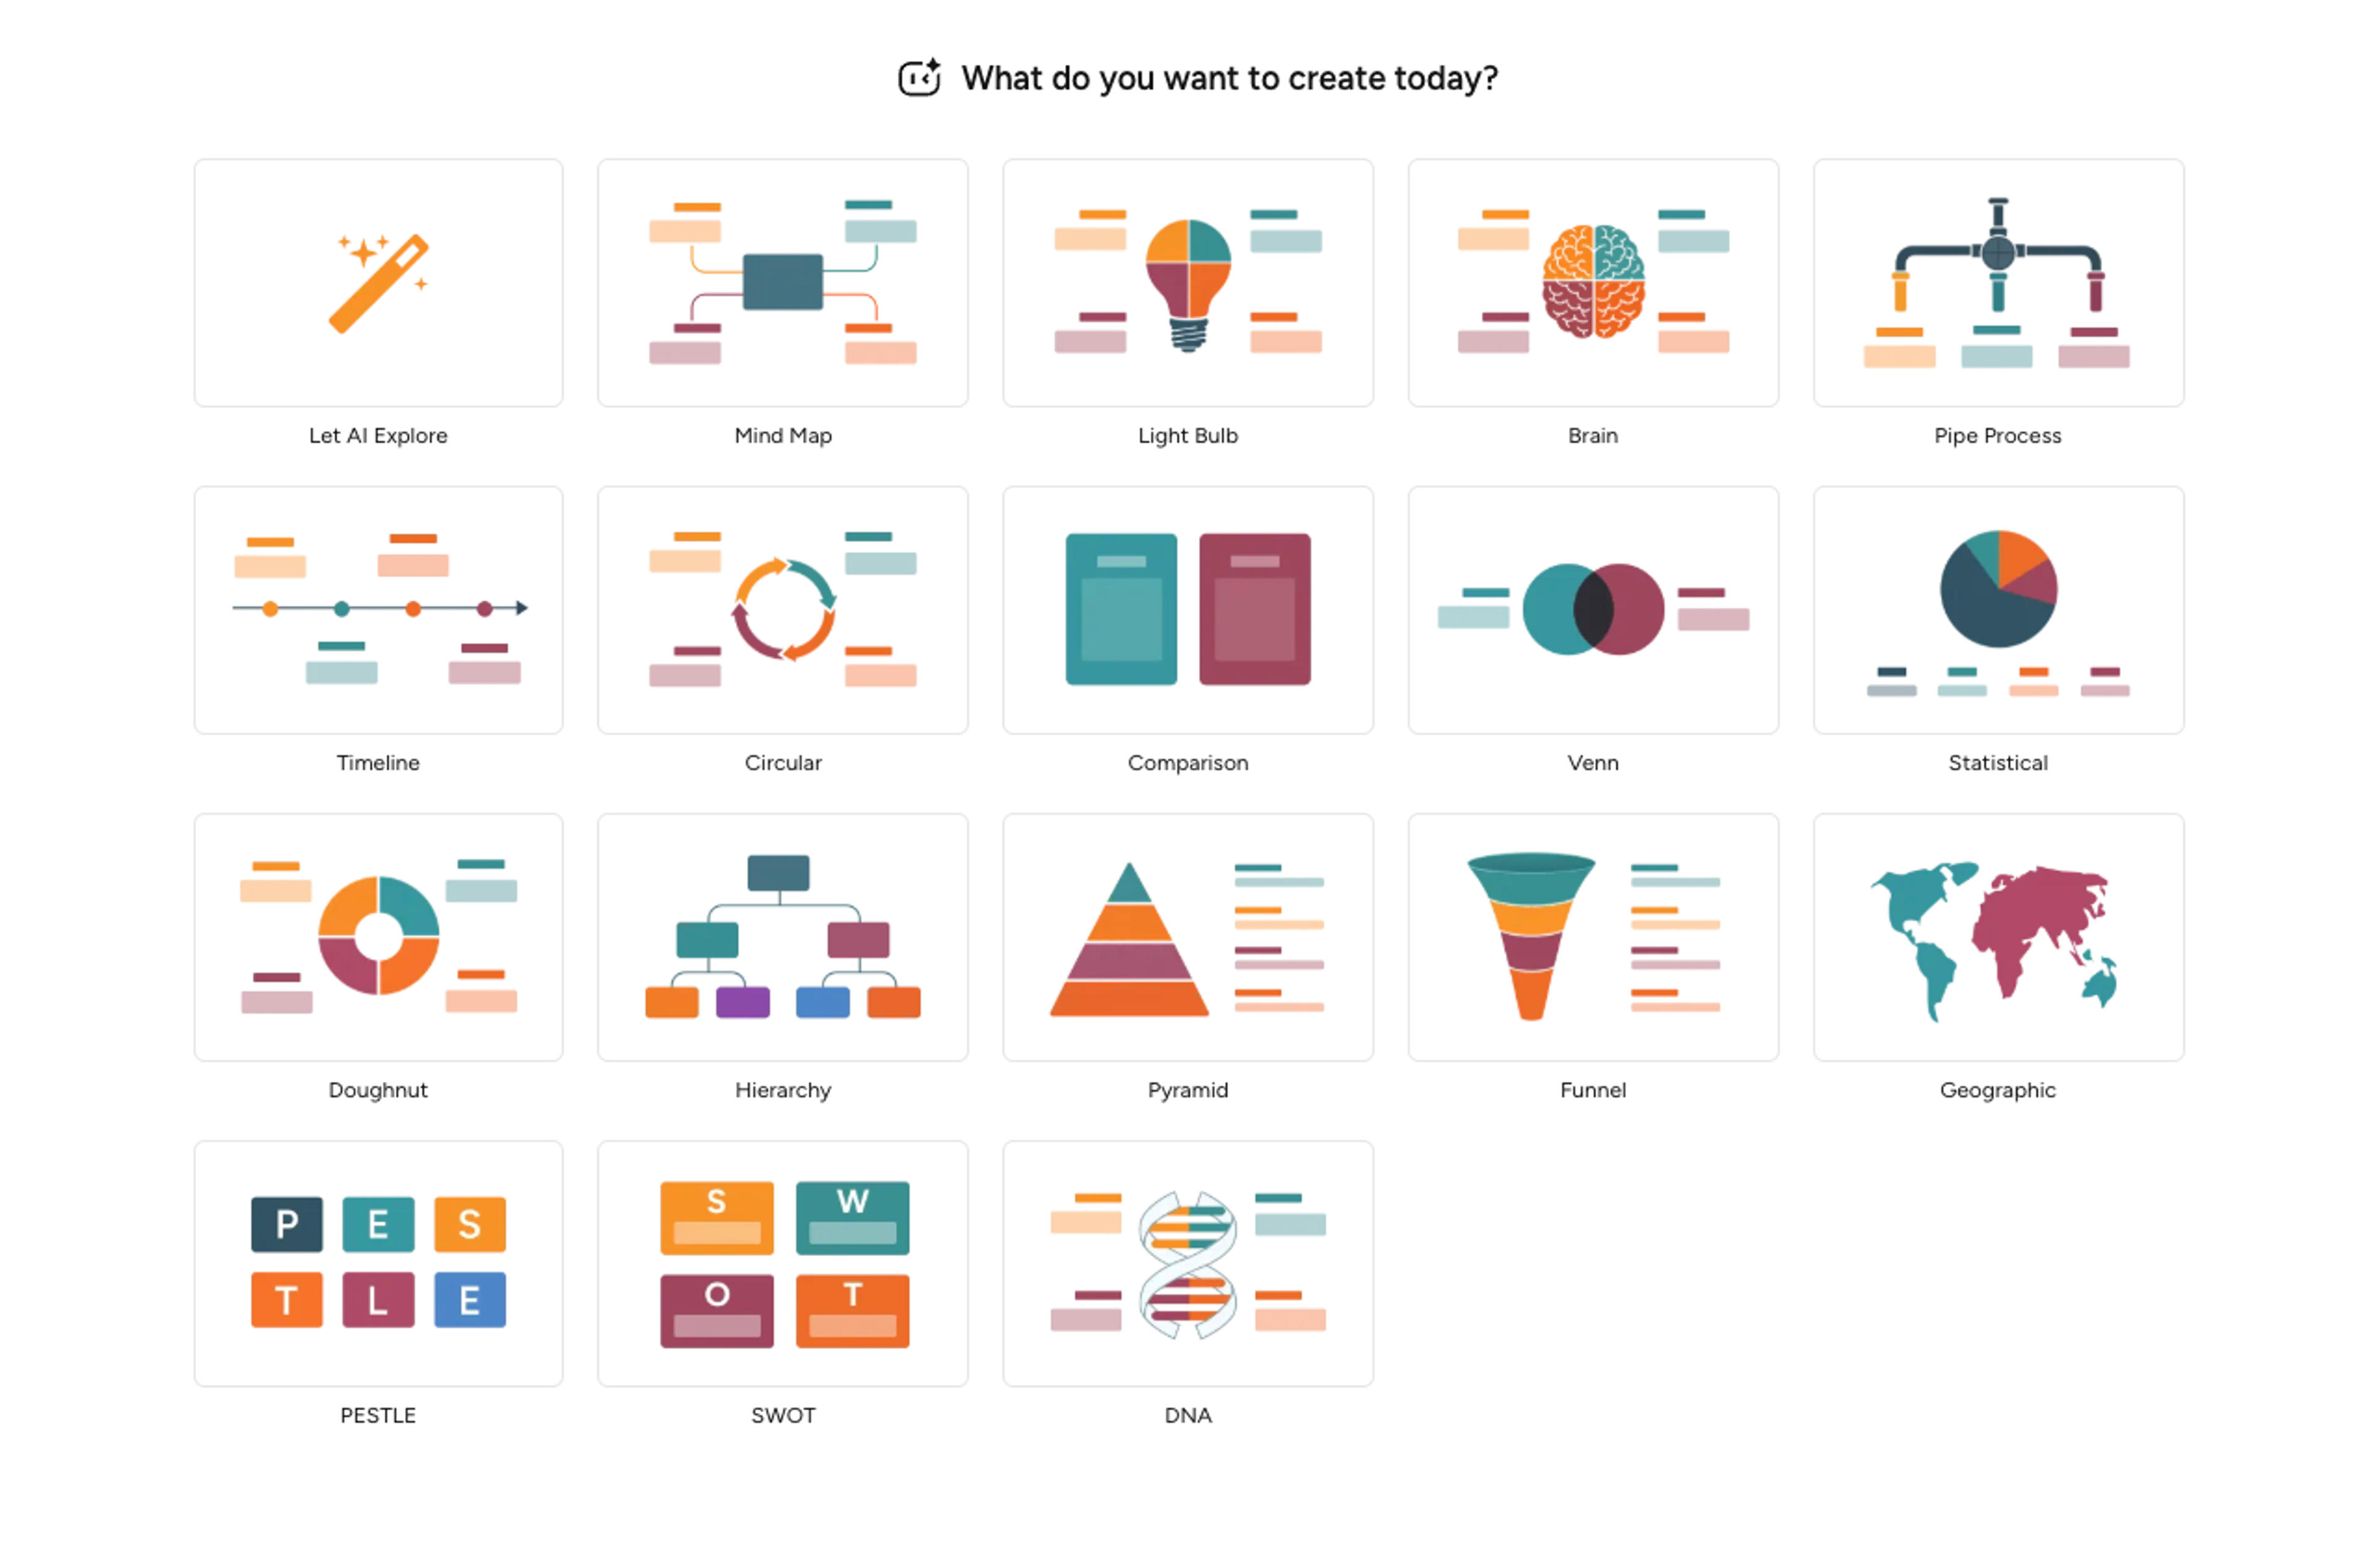
Choose the closest figure style or let AI decide whether the source needs a diagram, panel, timeline, flow, concept map, or infographic.
Infograph turns the source into labeled sections, hierarchy, captions, and readable visual structure so you are not starting from a blank canvas.
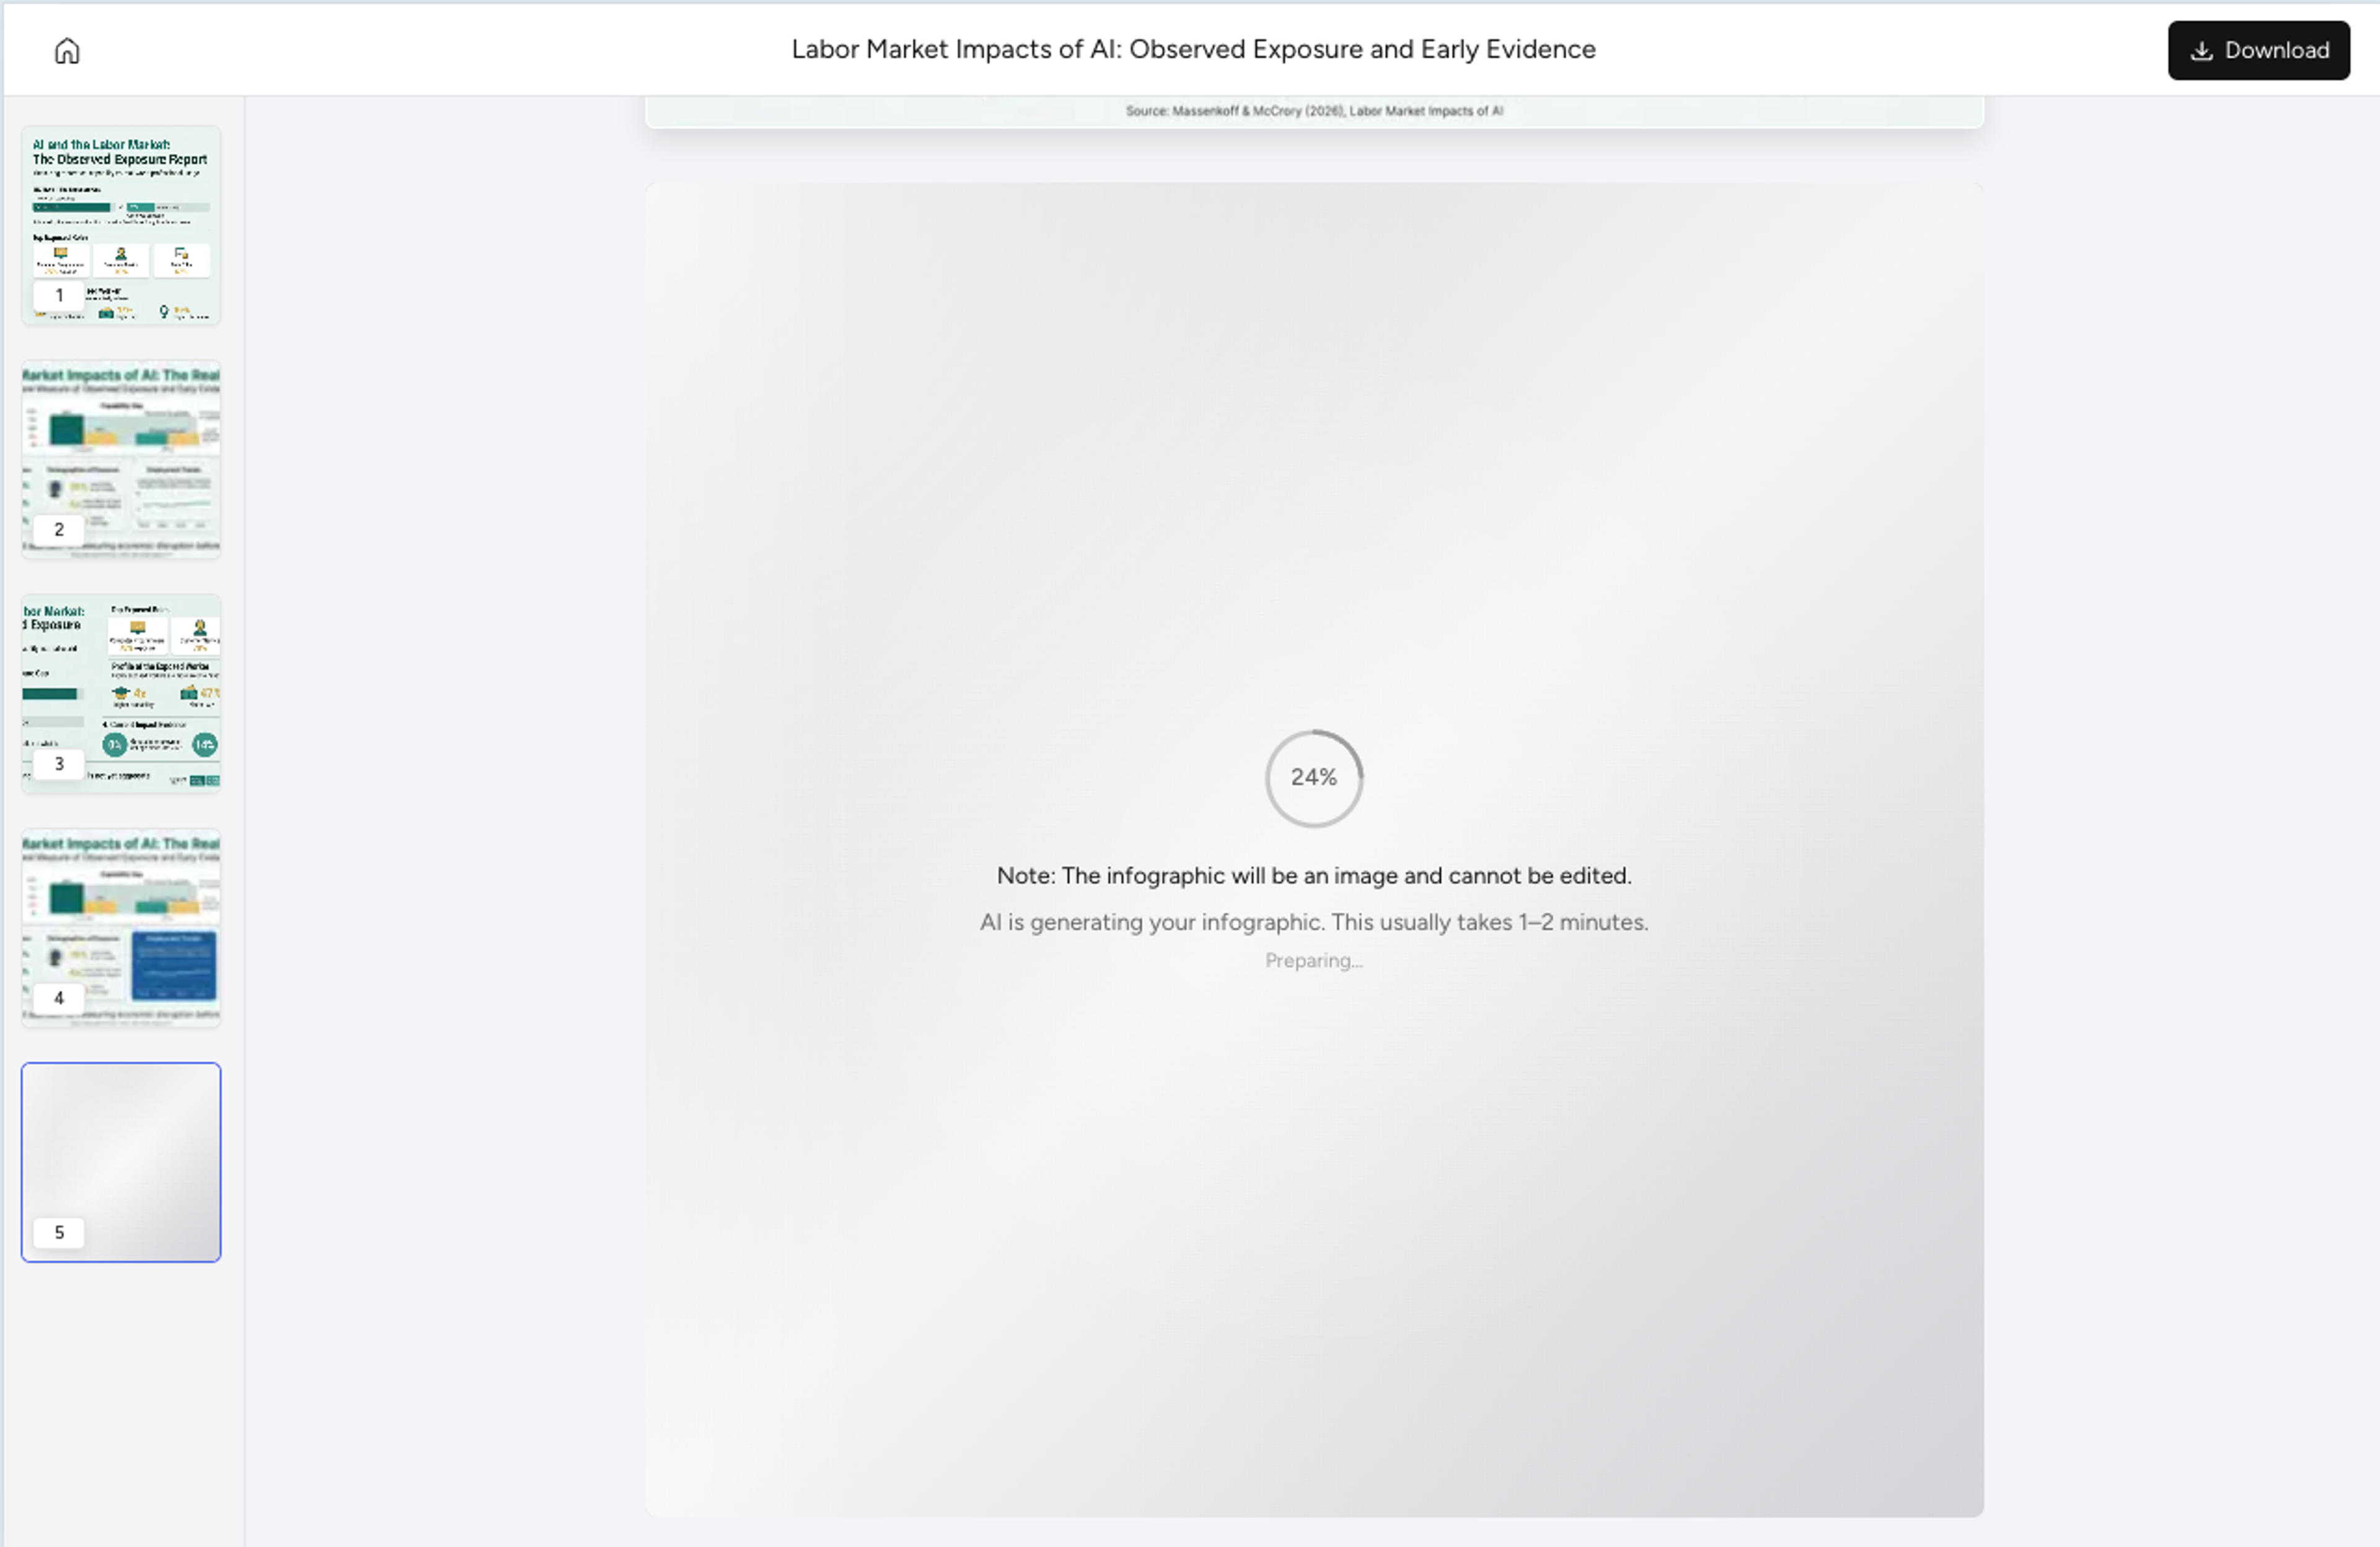
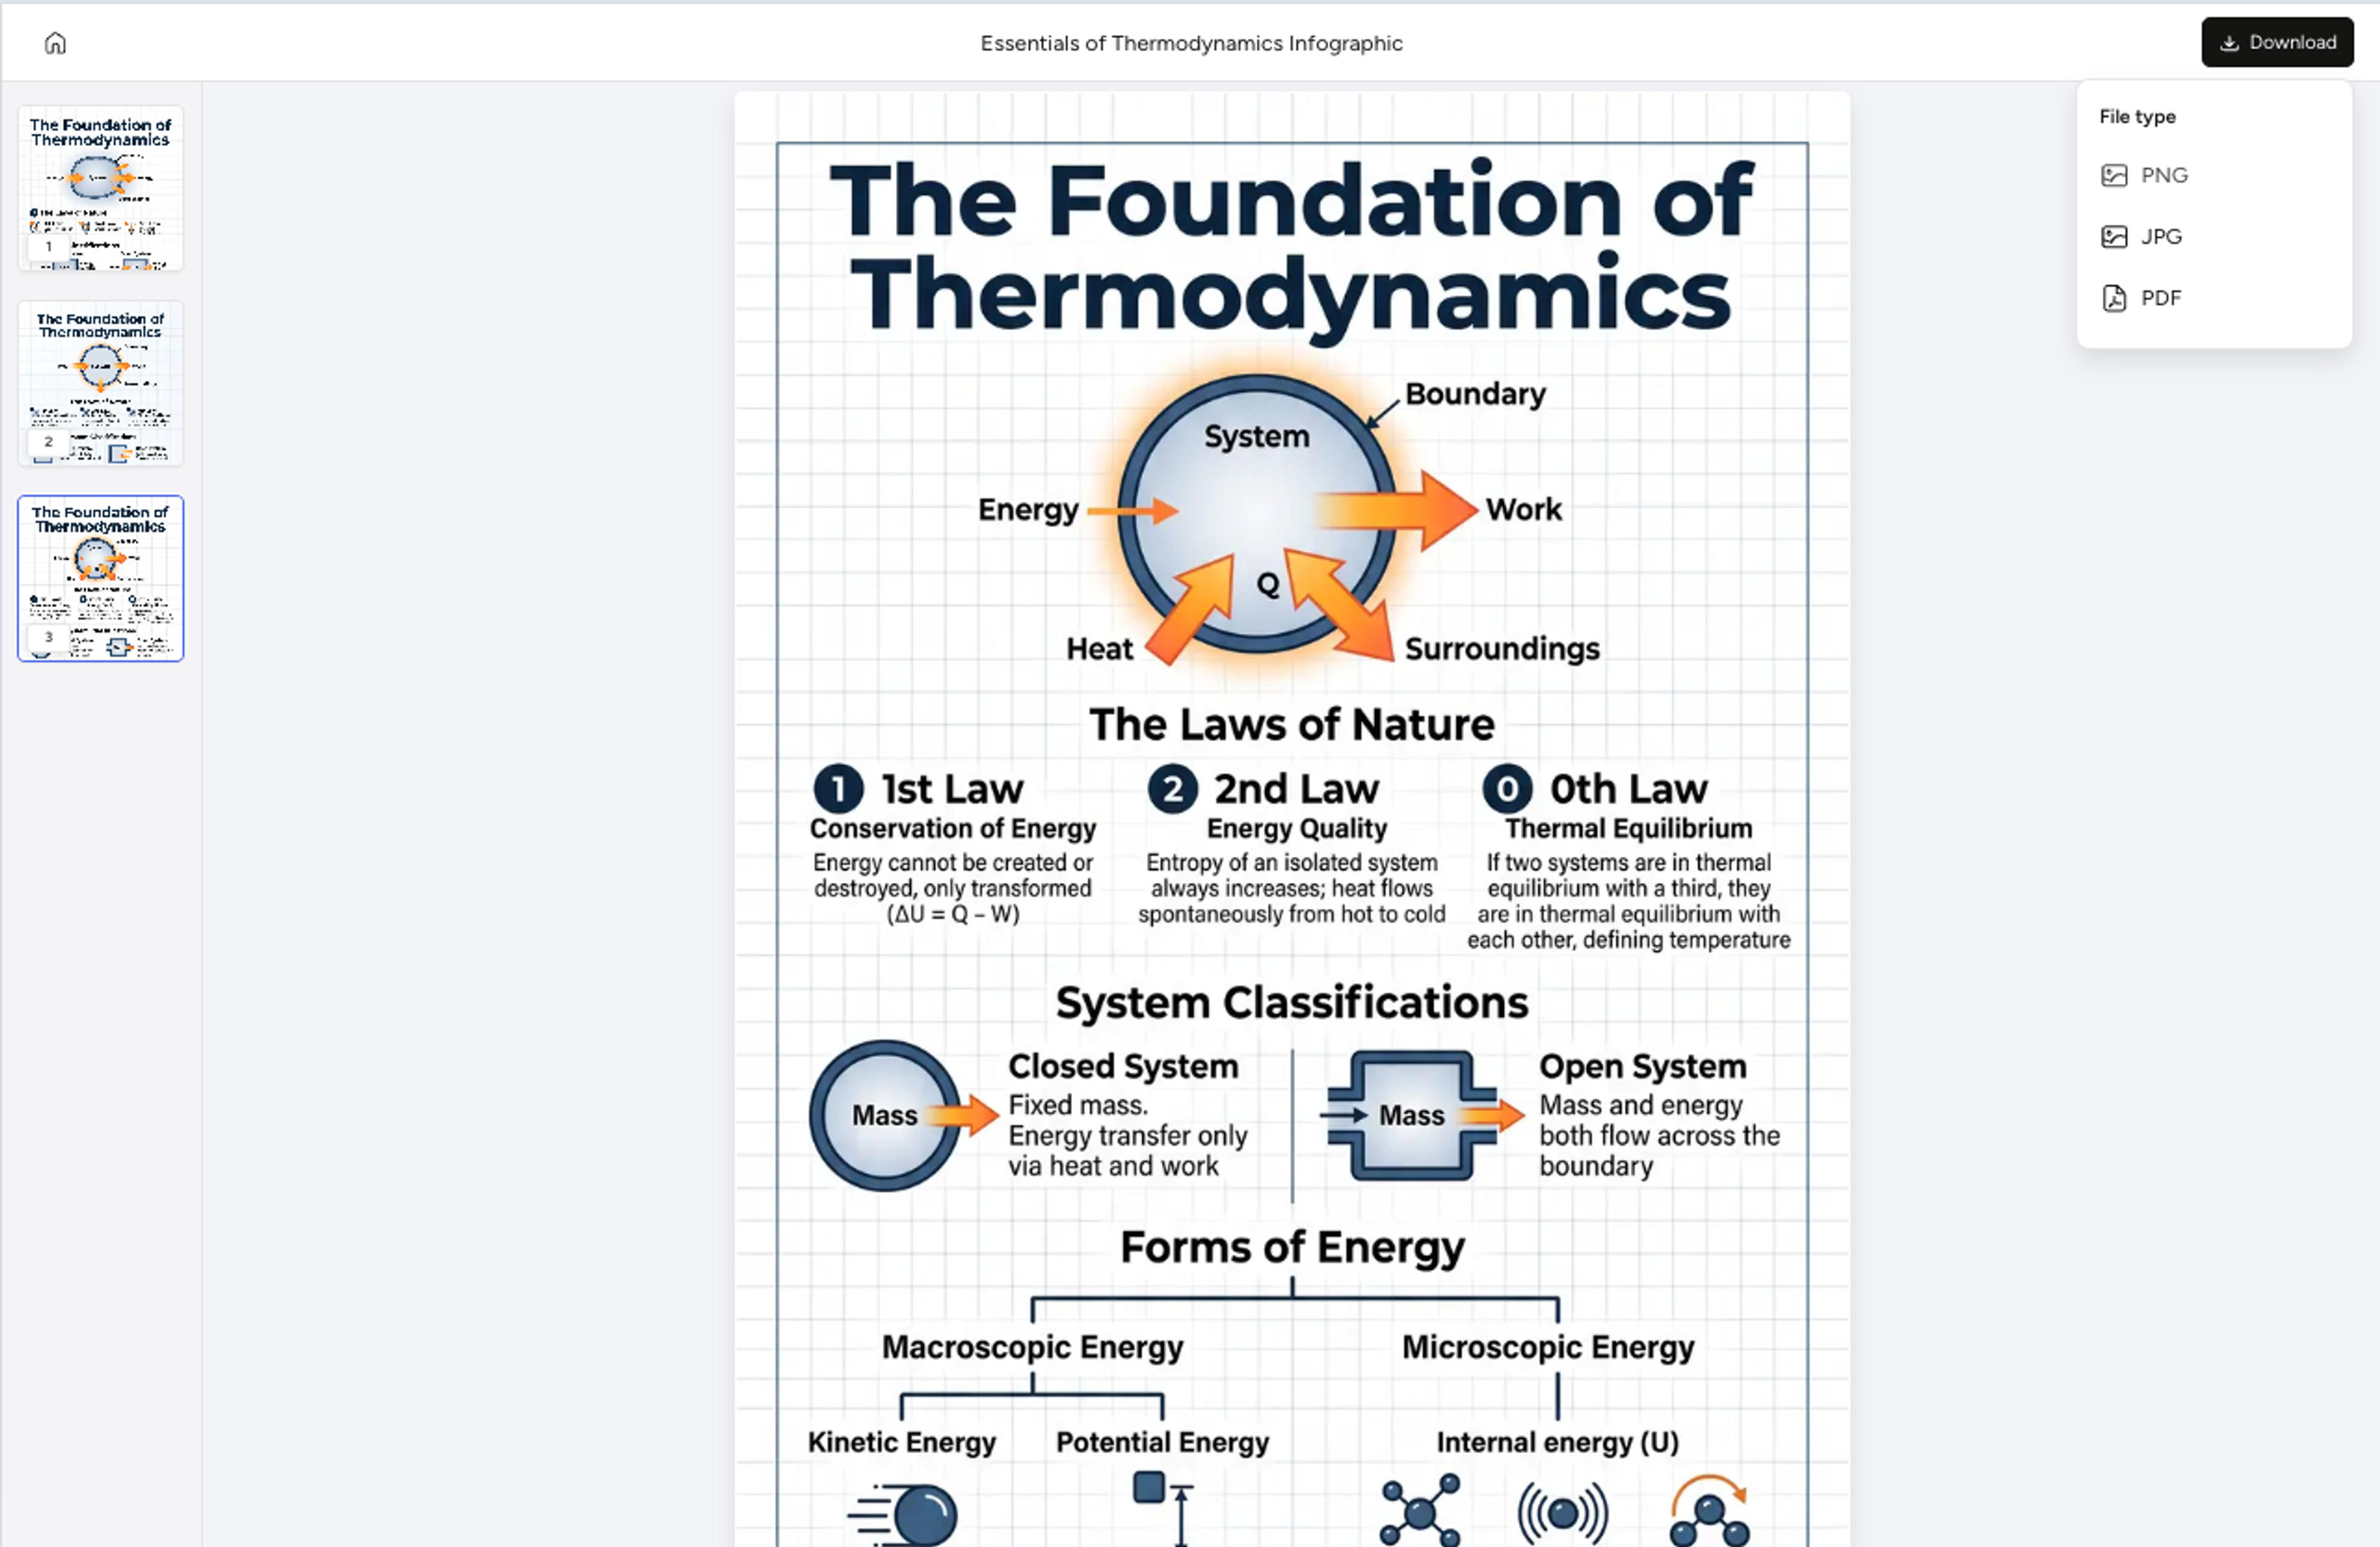
Ask AI to simplify labels, adjust layout, rewrite captions, or change emphasis, then export the final visual as PNG, JPG, or PDF.
Paste the concepts and let AI propose categories, overlaps, and labels.
Pull categories and shared traits from source text.
Generate concise labels for shared and distinct regions.
Simplify comparisons for classroom activities.
Compare themes, methods, populations, and findings.
Yes. Paste concepts, notes, or source material and Infograph will structure the comparison.
Yes. You can ask for two-set or three-set Venn diagrams depending on the comparison.
Yes. Venn diagrams are useful for classroom comparison exercises and concept review.
Yes. It works for literature themes, methods, populations, and theory comparisons.
PNG, JPG, and PDF.
Continue with adjacent AI tools for scientific figures, research diagrams, and academic infographics.
Create flowcharts from protocols, workflows, lesson material, notes, links, and process descriptions.
Create timelines from notes, papers, lesson plans, links, events, research milestones, and project histories.
Turn notes, papers, lesson plans, and topics into concept maps that show ideas, links, hierarchy, and relationships.
Turn research notes, methods, data, and science topics into labeled scientific figure drafts with AI.
Turn research findings, methods, literature notes, and data into clear academic infographics.
Turn papers, lab notes, links, text, and data into scientific figures, graphical abstracts, biology diagrams, and research visuals. AI Scientific Figure Maker | Built for research and education