
Infograph.me vs FigureLabs: AI Scientific Figure Generator Comparison
A comparison of Infograph.me and FigureLabs for AI scientific figure generation.
A comparison of Infograph.me and FigureLabs for AI scientific figure generation.
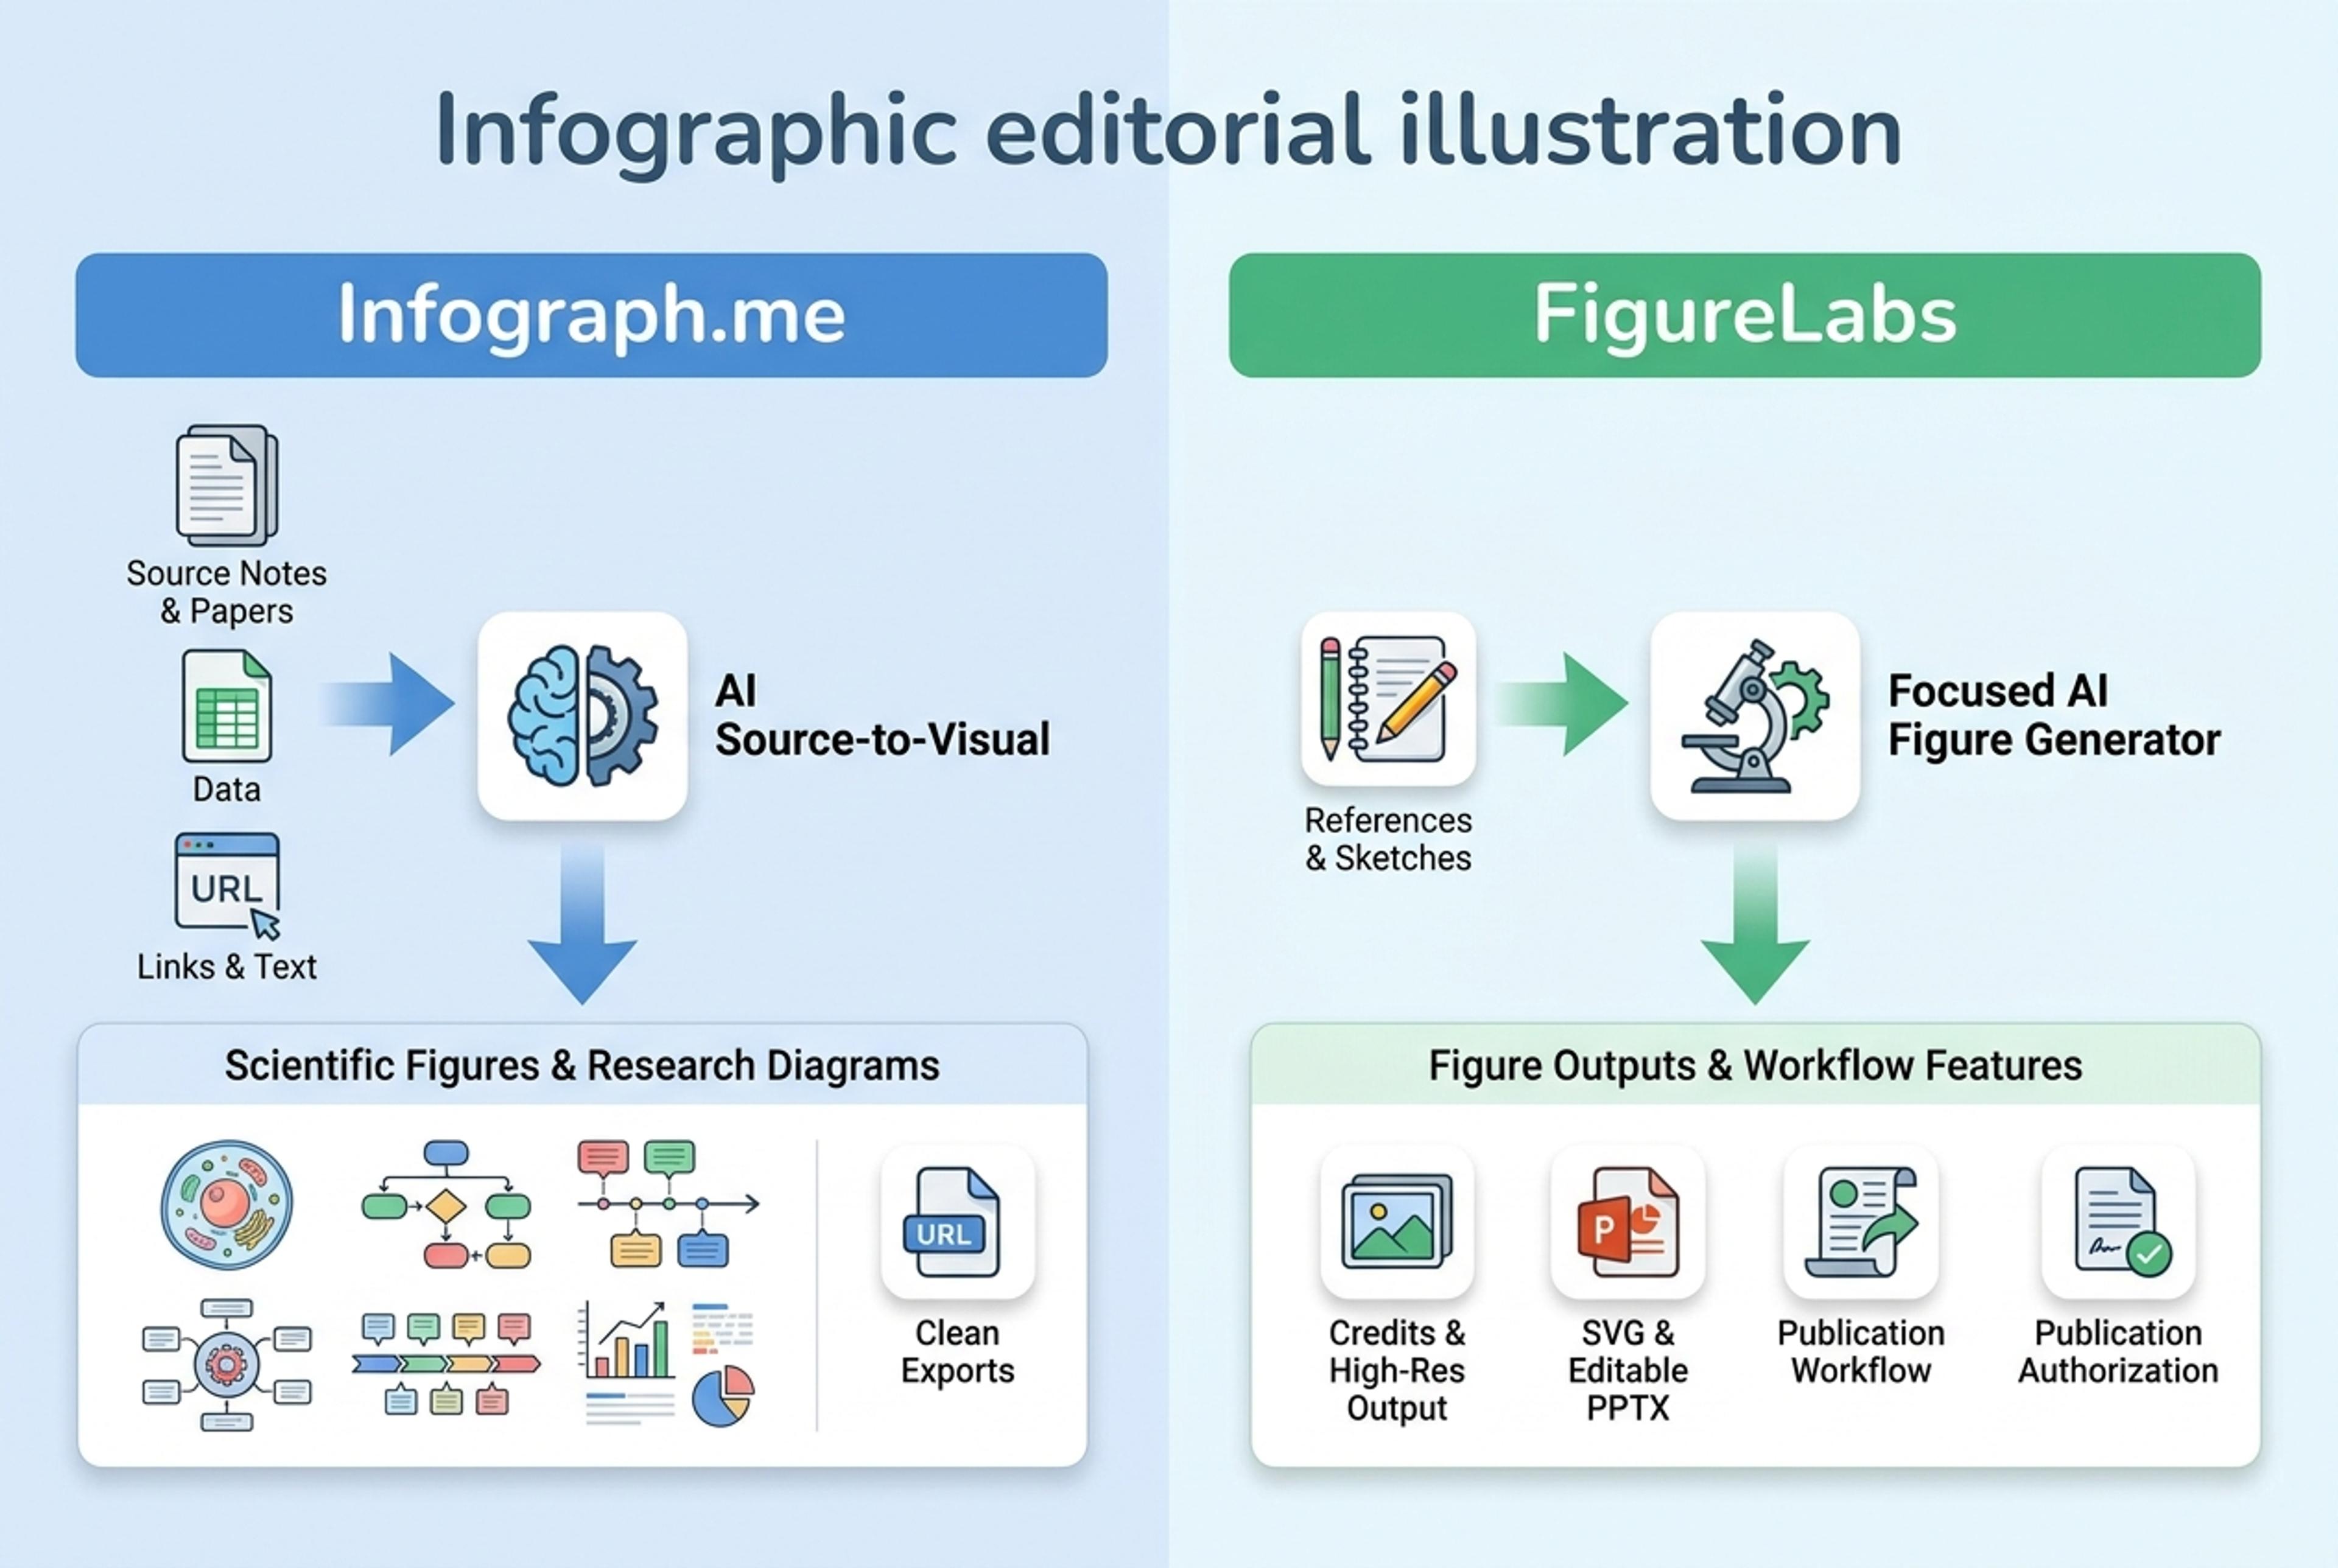
Infograph.me and FigureLabs are both positioned around AI scientific visuals, so this is the most direct comparison in the category.
Choose Infograph.me if you want AI scientific figures plus broader research and education diagrams: graphical abstracts, research infographics, biology diagrams, timelines, flowcharts, Venn diagrams, concept maps, and source-to-visual workflows from notes, papers, text, data, links, and topics.
Choose FigureLabs if you want a focused AI scientific figure product with a clear pricing ladder around credits, storage, high-resolution export, SVG, editable PPTX, built-in canvas, and publication authorization.
Pricing changes, so check each official pricing page before buying. Based on the FigureLabs pricing screens reviewed on 2026-07-01, FigureLabs currently shows these public tiers:
| Plan area | Infograph.me | FigureLabs monthly | FigureLabs annual |
|---|---|---|---|
| Free plan | Free is $0: limited credits for AI features, basic image models, up to 2K resolution, and import from PDF, Word, PPTX, links, and text | Free, $0/month, 150 credits/month, 50 refresh credits every day, 1GB storage, 1K HD image export, Flowcharts SVG | Free, $0/month |
| Starter | Infograph.me Plus is $12/month billed monthly, with 300 credits for AI features, premium image models, 4K output, PNG/JPG/PDF and Editable PPT download, no branding, and a 3-day money-back guarantee | $12/month, 1,000 credits/month, 10GB storage, 4K HD image export, SVG, editable PPTX, built-in canvas, publication authorization | $10/month, billed yearly at $120 |
| Plus | Infograph.me Plus yearly is $9/month, billed annually at $108/year, with the same Plus features and up to 25% savings | $35/month, 5,000 credits/month, 50GB storage, 8K HD image export, SVG, editable PPTX, built-in canvas, publication authorization | $20/month, billed yearly at $240 |
| Pro | Infograph.me currently shows Free and Plus in-app; heavier users should evaluate Plus credit usage and export needs | $99/month, 20,000 credits/month, 300GB storage, 8K HD image export, SVG, editable PPTX, built-in canvas, publication authorization | $54/month, billed yearly at $648 |
| Pricing implication | Infograph.me is simpler: Free for testing and Plus for 300 AI credits, premium models, 4K output, clean exports, and no branding | FigureLabs is transparent and credit-based | Annual plans show large discounts, especially Plus and Pro |
| Decision point | Infograph.me | FigureLabs |
|---|---|---|
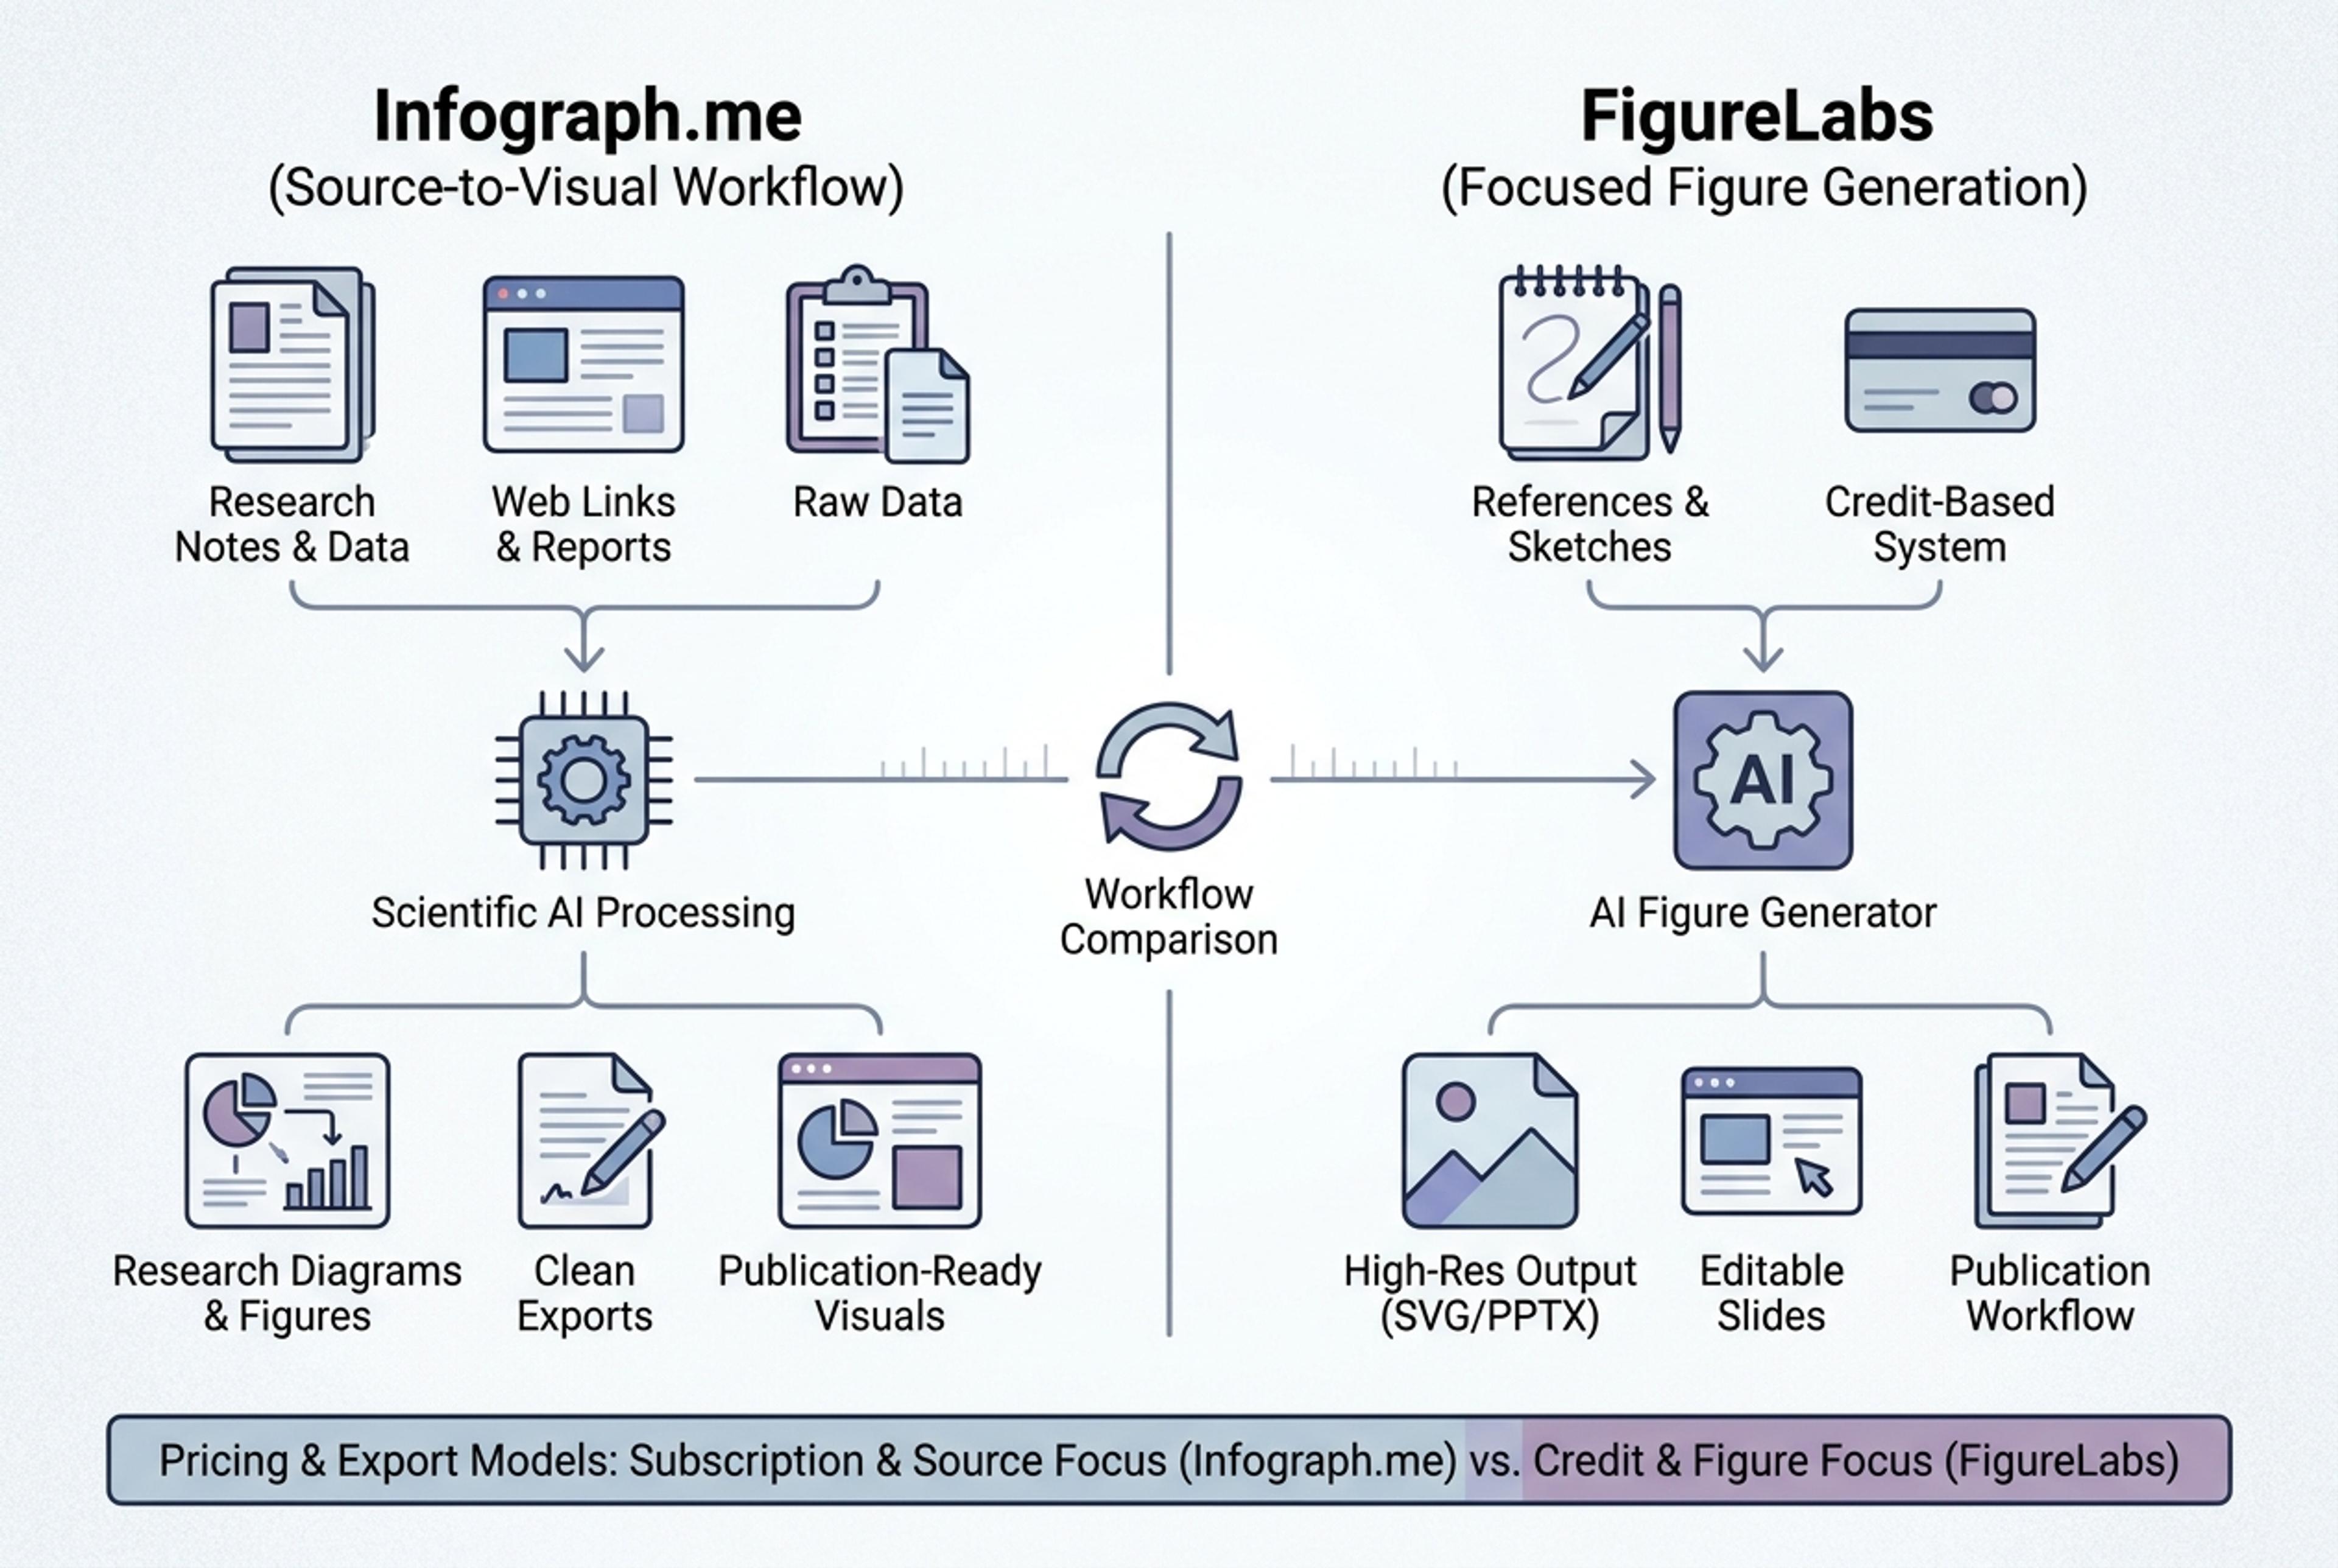
| Primary workflow | Source-to-visual across scientific figures, research visuals, and infographics | AI scientific figure generation with credit-based plans |
| Best fit | Researchers and educators who need figures plus diagrams and infographics | Users focused narrowly on AI-generated scientific figures and export formats |
| Source material | Papers, notes, links, text, data, topics, methods, results, and classroom content | Text, sketches, references, and scientific figure prompts |
| Format range | Scientific figures, graphical abstracts, biology diagrams, research infographics, flowcharts, timelines, Venn diagrams, and concept maps | Scientific figures, high-res images, SVG, editable PPTX, built-in canvas |
| SEO scope | Scientific figures plus education, research, and diagram formats | Scientific figure keywords and AI figure generation |
| Differentiation | AI Scientific Figures = Infograph.me, with broader infographic demand supporting the science positioning | New AI scientific figure challenger with visible pricing tiers and export claims |
| Pricing visibility | Free is $0; Plus is $12/month monthly or $9/month yearly at $108/year, with 300 credits, premium image models, 4K output, PNG/JPG/PDF and Editable PPT export | Public tiers from Free to Pro, with monthly and annual credit packages |
Infograph.me is strongest when the hard part is getting from source material to a visual structure. Instead of starting with a blank canvas, you can bring in the research or lesson content first and let AI create the first visual draft.
FigureLabs may be the better fit when you want its focused AI scientific figure workflow and clearly packaged export tiers.
Use Infograph.me when your question is: "How do I turn this paper, note, lesson, data, or topic into a clear scientific visual quickly?"
Use FigureLabs when your question is: "How do I use a focused AI scientific figure generator with a transparent credit and export pricing ladder?"
Infograph.me is being rebuilt around AI scientific figures and research visuals. General infographic formats still matter, but they support the main positioning: scientific figures, graphical abstracts, biology diagrams, education visuals, and research infographics.
FigureLabs is a direct category competitor and does a good job making the science-first positioning obvious. Infograph.me should compete by being equally clear on AI scientific figures while also owning the broader source-to-visual workflow for research and education.
This comparison is based on the public positioning of Infograph.me, FigureLabs, and the FigureLabs pricing screens reviewed on 2026-07-01. Product features and pricing can change, so check official product pages before making a final decision.
Turn research notes, methods, data, and science topics into labeled scientific figure drafts with AI.
Generate clear scientific illustrations, concept diagrams, and explanation visuals from text, papers, links, and topics.
Create graphical abstract drafts from papers, abstracts, methods, findings, and research notes.
Turn research findings, methods, literature notes, and data into clear academic infographics.
Generate biology diagrams from topics, notes, papers, links, and classroom material with AI.
Turn notes, papers, lesson plans, and topics into concept maps that show ideas, links, hierarchy, and relationships.
Turn papers, lab notes, links, text, and data into scientific figures, graphical abstracts, biology diagrams, and research visuals. AI Scientific Figure Maker | Built for research and education