
Infograph.me vs Venngage: Scientific Figures or General Infographics?
A science-first comparison of Infograph.me and Venngage for scientific figures, research visuals, and general infographic design.
A science-first comparison of Infograph.me and Venngage for scientific figures, research visuals, and general infographic design.
Infograph.me and Venngage both help people create visual communication assets, but they now sit in different categories.
Choose Infograph.me if your work is science, education, research, or technical communication: lab notes, papers, methods, results, links, tables, biology topics, classroom material, or research sources that need to become a scientific figure, graphical abstract, research infographic, or diagram.
Choose Venngage if you want a mature general infographic design platform with a large template library, brand controls, collaboration workflows, accessibility tooling, and broader manual customization for business, marketing, HR, nonprofit, and education content.
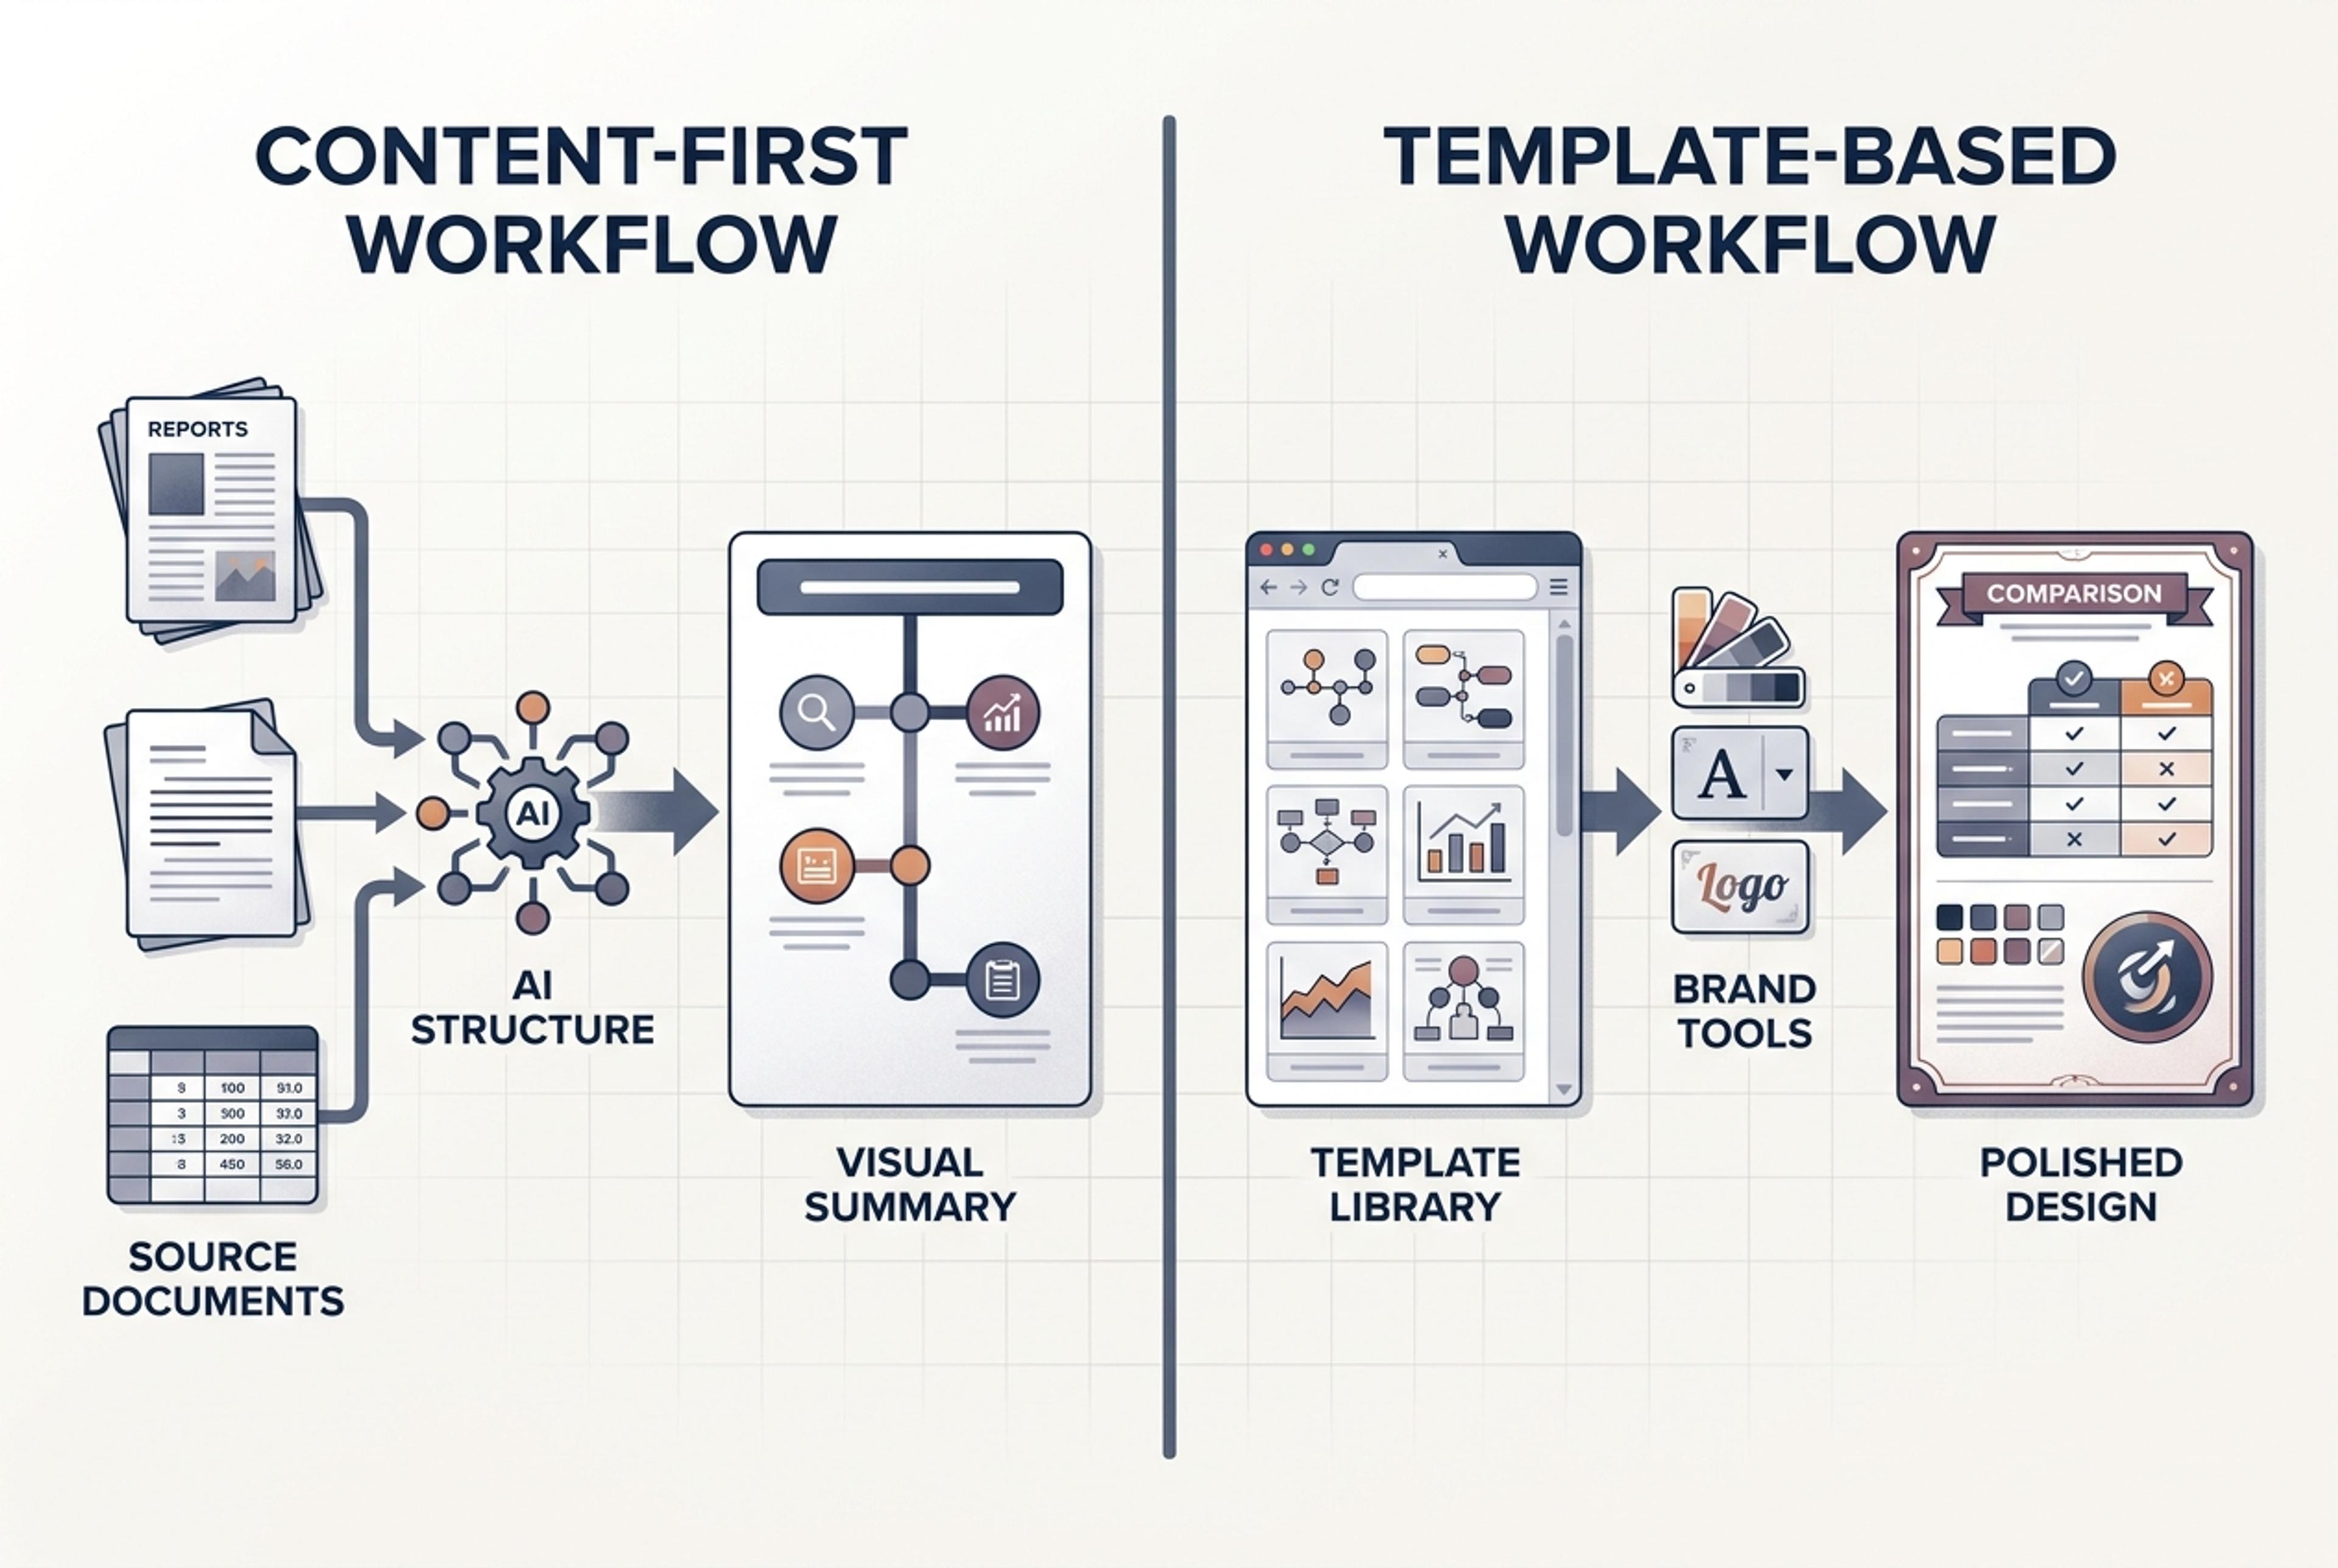
| Decision point | Infograph.me | Venngage |
|---|---|---|
| Best fit | AI scientific figures, graphical abstracts, research infographics, biology diagrams, classroom science visuals, and technical diagrams | Polished general infographics from prompts, templates, brand assets, charts, and collaborative design workflows |
| Primary workflow | Science source-to-visual: upload or paste real research or lesson content, let AI structure it, then refine with AI edits | Prompt-or-template-to-design: generate or choose a layout, then customize with editor tools, brand kit, charts, and AI helpers |
| Source material | Strong fit for lab notes, paper abstracts, methods, results, links, pasted text, tables, topics, and research-heavy material | Supports prompts and file uploads including documents and data files, with strong template-based starts |
| Template depth | Focused on AI-generated scientific and research visual formats | Stronger fit if you want a large browsable template library and many general design starting points |
| Data visualization | Good fit for converting research tables, comparisons, timelines, relationships, and methods into visual explanations | Strong fit for editable charts, CSV/Excel-driven visuals, maps, social sizes, and presentation/report exports |
| Scientific and technical visuals | Stronger fit for scientific figures, research diagrams, biology visuals, medical drawings, methods diagrams, and academic communication | Better fit for general business, marketing, HR, education, nonprofit, and brand communications |
| Editing model | AI-first editing: ask for layout, wording, hierarchy, figure structure, chart, or diagram changes after generation | Editor-first customization with AI writing, brand tools, icons/images, chart editing, and accessibility checks |
| Team and brand workflow | Best when speed from source content to research visual matters more than managing a full design system | Stronger fit for teams needing brand kit, collaboration, accessibility, and repeatable design governance |
| Export and sharing | Useful for exporting research visuals into common document, report, poster, and presentation workflows | Strong fit for PNG, PDF, PPT, HTML, private links, campaign assets, reports, and presentations |
| Pricing shape | Free is $0; Plus is $12/month monthly or $9/month yearly at $108/year, with 300 credits, premium image models, 4K output, PNG/JPG/PDF and Editable PPT export | Broader paid tiers for design capacity, brand controls, collaboration, exports, and team workflows |
Pricing can change, so check both products before buying. The key difference is not only the monthly price; it is what you are paying for.
Infograph.me currently shows two plans in-app. Free is $0 and includes limited credits for AI features, basic image models, up to 2K resolution, and import from PDF, Word, PPTX, links, and text. Plus is $12/month when billed monthly, or $9/month when billed yearly at $108/year, with up to 25% savings. Plus includes 300 credits for AI features, premium image models, 4K high-resolution output, PNG/JPG/PDF and Editable PPT downloads, no Infograph.me branding, and a 3-day money-back guarantee. The value is speed from source material to a usable scientific figure or research visual.
Venngage uses a broader design-platform pricing model. It can justify higher team-oriented pricing when a team will actually use brand controls, collaboration, template governance, accessibility checks, and recurring design production.
The practical takeaway: Infograph.me is easier to justify when the work is research, science, technical explanation, or education. Venngage is easier to justify when the work is repeated branded communication across many general business or marketing assets.
Infograph.me is strongest when the visual is not starting from a blank canvas. If you already have a PDF, Word document, article, research note, lab protocol, table, paper abstract, or web page, the main challenge is not choosing a template. The challenge is reading the source, finding the structure, and turning the information into a figure people can understand quickly.
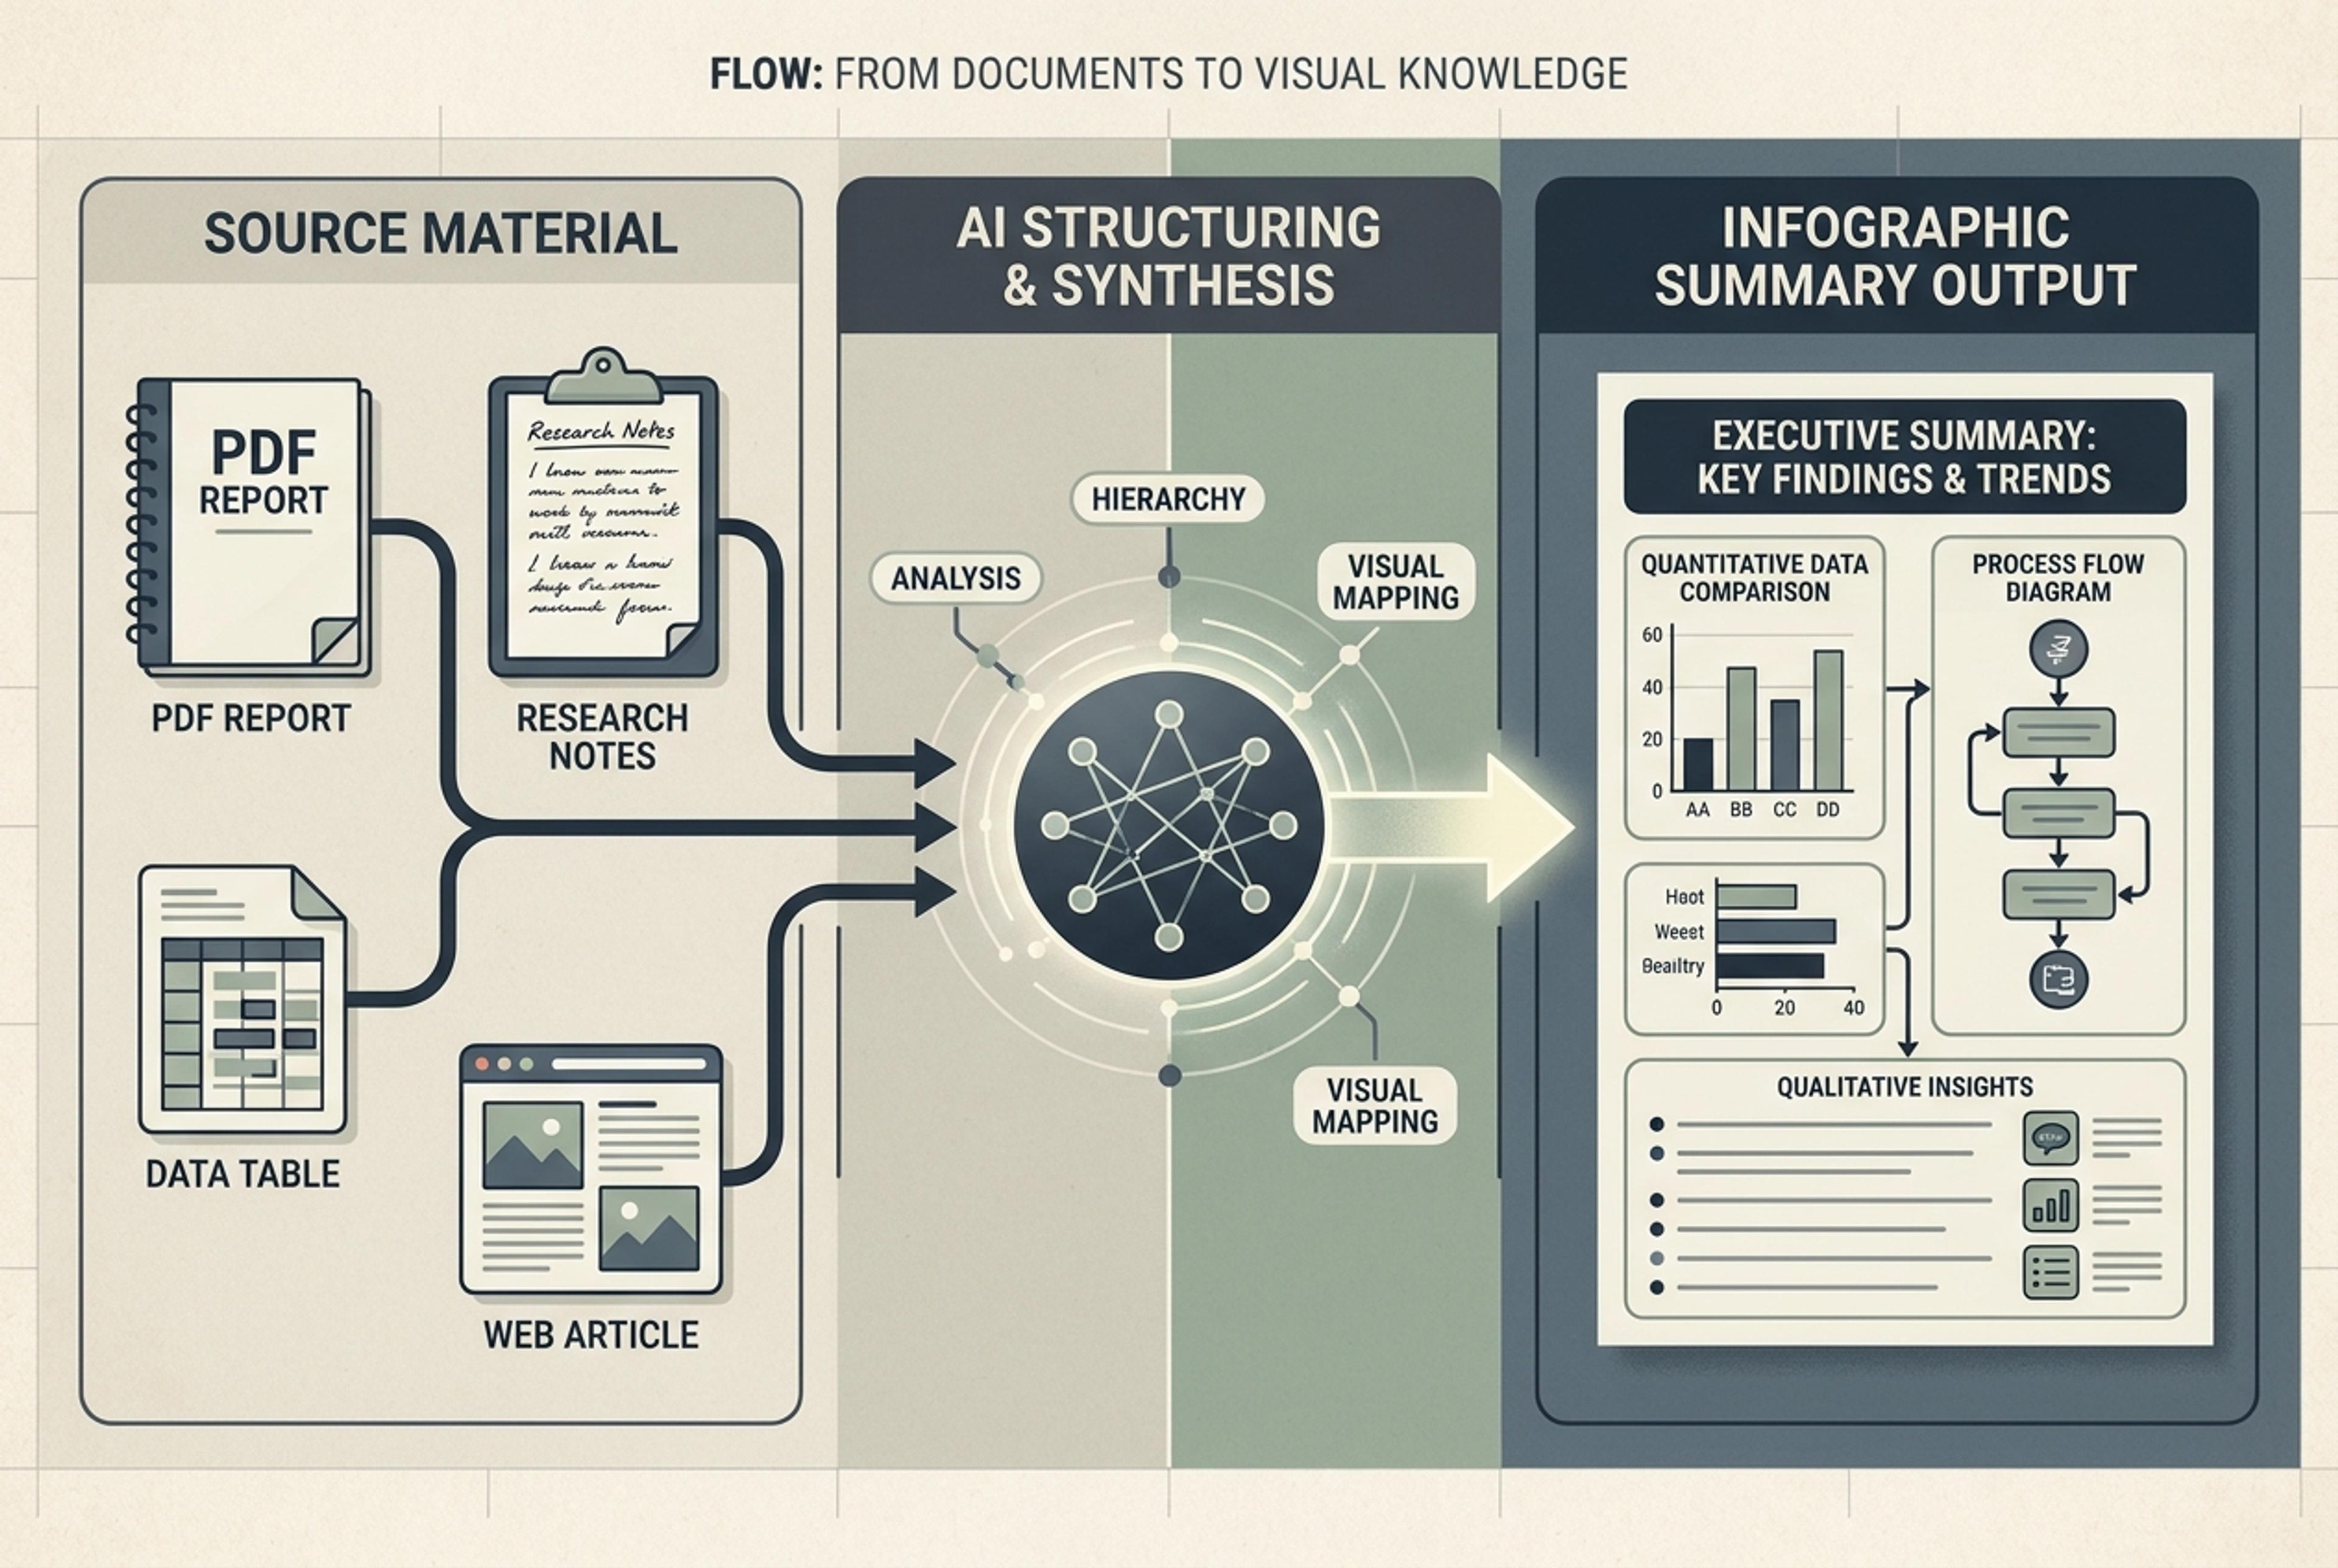
That makes Infograph.me a better fit for science and research workflows such as:
If your team needs to move from source material to a scientific or research visual fast, Infograph.me is usually the more direct workflow.
Venngage is broader and more mature as a general design platform. Its public product pages emphasize a large infographic template library, AI generation, editable charts, brand kit workflows, accessibility tools, collaboration, and exports for reports, presentations, campaigns, and social channels.
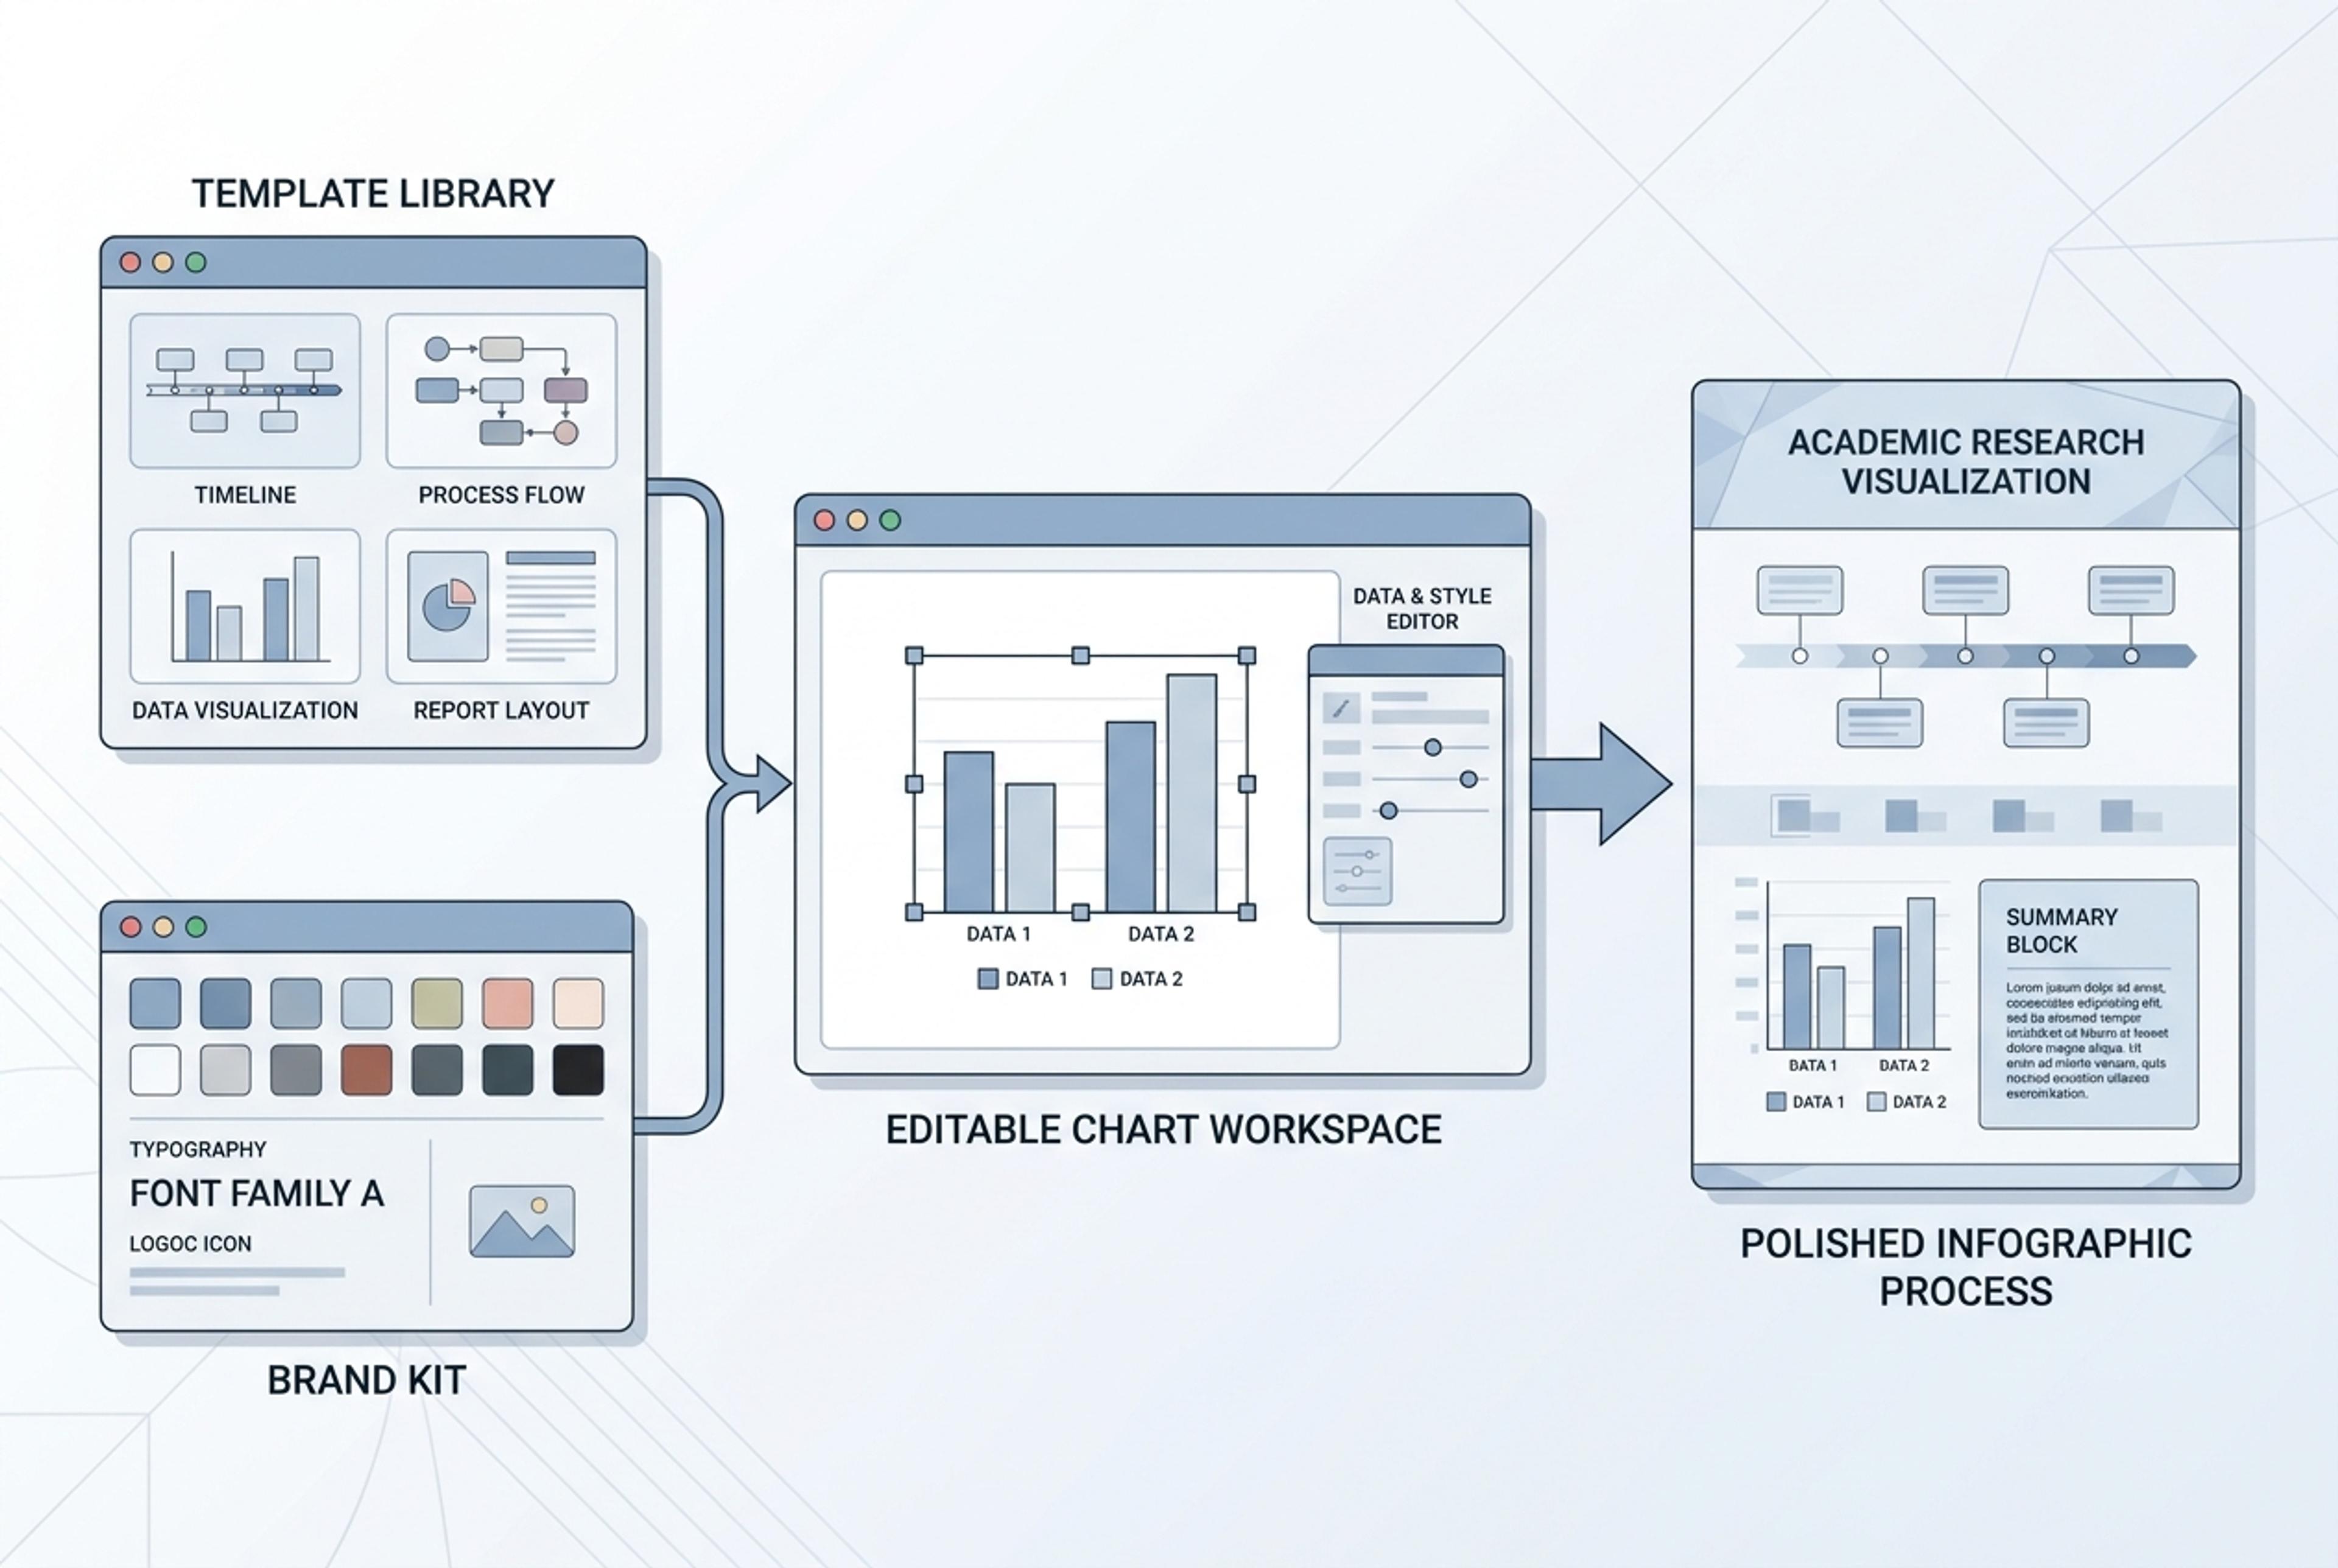
Venngage is a strong fit when you want to:
If your main need is a polished branded design system around general infographics, Venngage may be the more complete platform.
The simplest way to compare the two tools is this:
That difference matters more than a generic feature checklist. A researcher converting methods and results into a figure has a different job from a marketing team producing a branded campaign infographic every week.
Use Infograph.me when the hard part is understanding and restructuring science or research source material. It is the better starting point for scientific figure generation, graphical abstracts, research infographics, educational science visuals, technical diagrams, and quick AI edits.
Use Venngage when the hard part is consistent presentation quality across many branded assets. It is especially useful when your team needs a large template library, brand controls, chart editing, accessibility checks, collaboration, and flexible exports.
Infograph.me and Venngage are not interchangeable tools with different logos. They optimize for different parts of visual communication.
If your question is "How do I turn this paper, lab note, lesson, data, or research source into a clear scientific figure or research visual?" start with Infograph.me.
If your question is "How do I produce polished, branded infographics in a full design workspace?" Venngage is worth considering.
This comparison is based on the current public positioning of Infograph.me, Venngage, Venngage pricing, Venngage's AI Infographic Generator, and Venngage infographic templates. Product positioning, prices, and feature packaging can change, so check the official product pages before making a final decision.
Upload a research paper, white paper, or report PDF and Infograph extracts the structure to render a clean infographic — no copy-paste between tools.
Upload a .docx — strategy memo, research note, internal report — and Infograph turns the structure into a clean infographic without rewriting the doc.
Drop in a CSV, paste a markdown table, or upload a sheet and Infograph turns the rows into a chart-driven infographic instead of a wall of numbers.
Turn methods sections, results tables, and lab notes into publication-ready scientific figures without rebuilding diagrams in vector software.
Turn papers, lab notes, links, text, and data into scientific figures, graphical abstracts, biology diagrams, and research visuals. AI Scientific Figure Maker | Built for research and education