

Step 1: Upload the PDF
Drop your PDF — research paper, white paper, internal report, or pitch document. The AI reads the body text, figures, and tables directly.
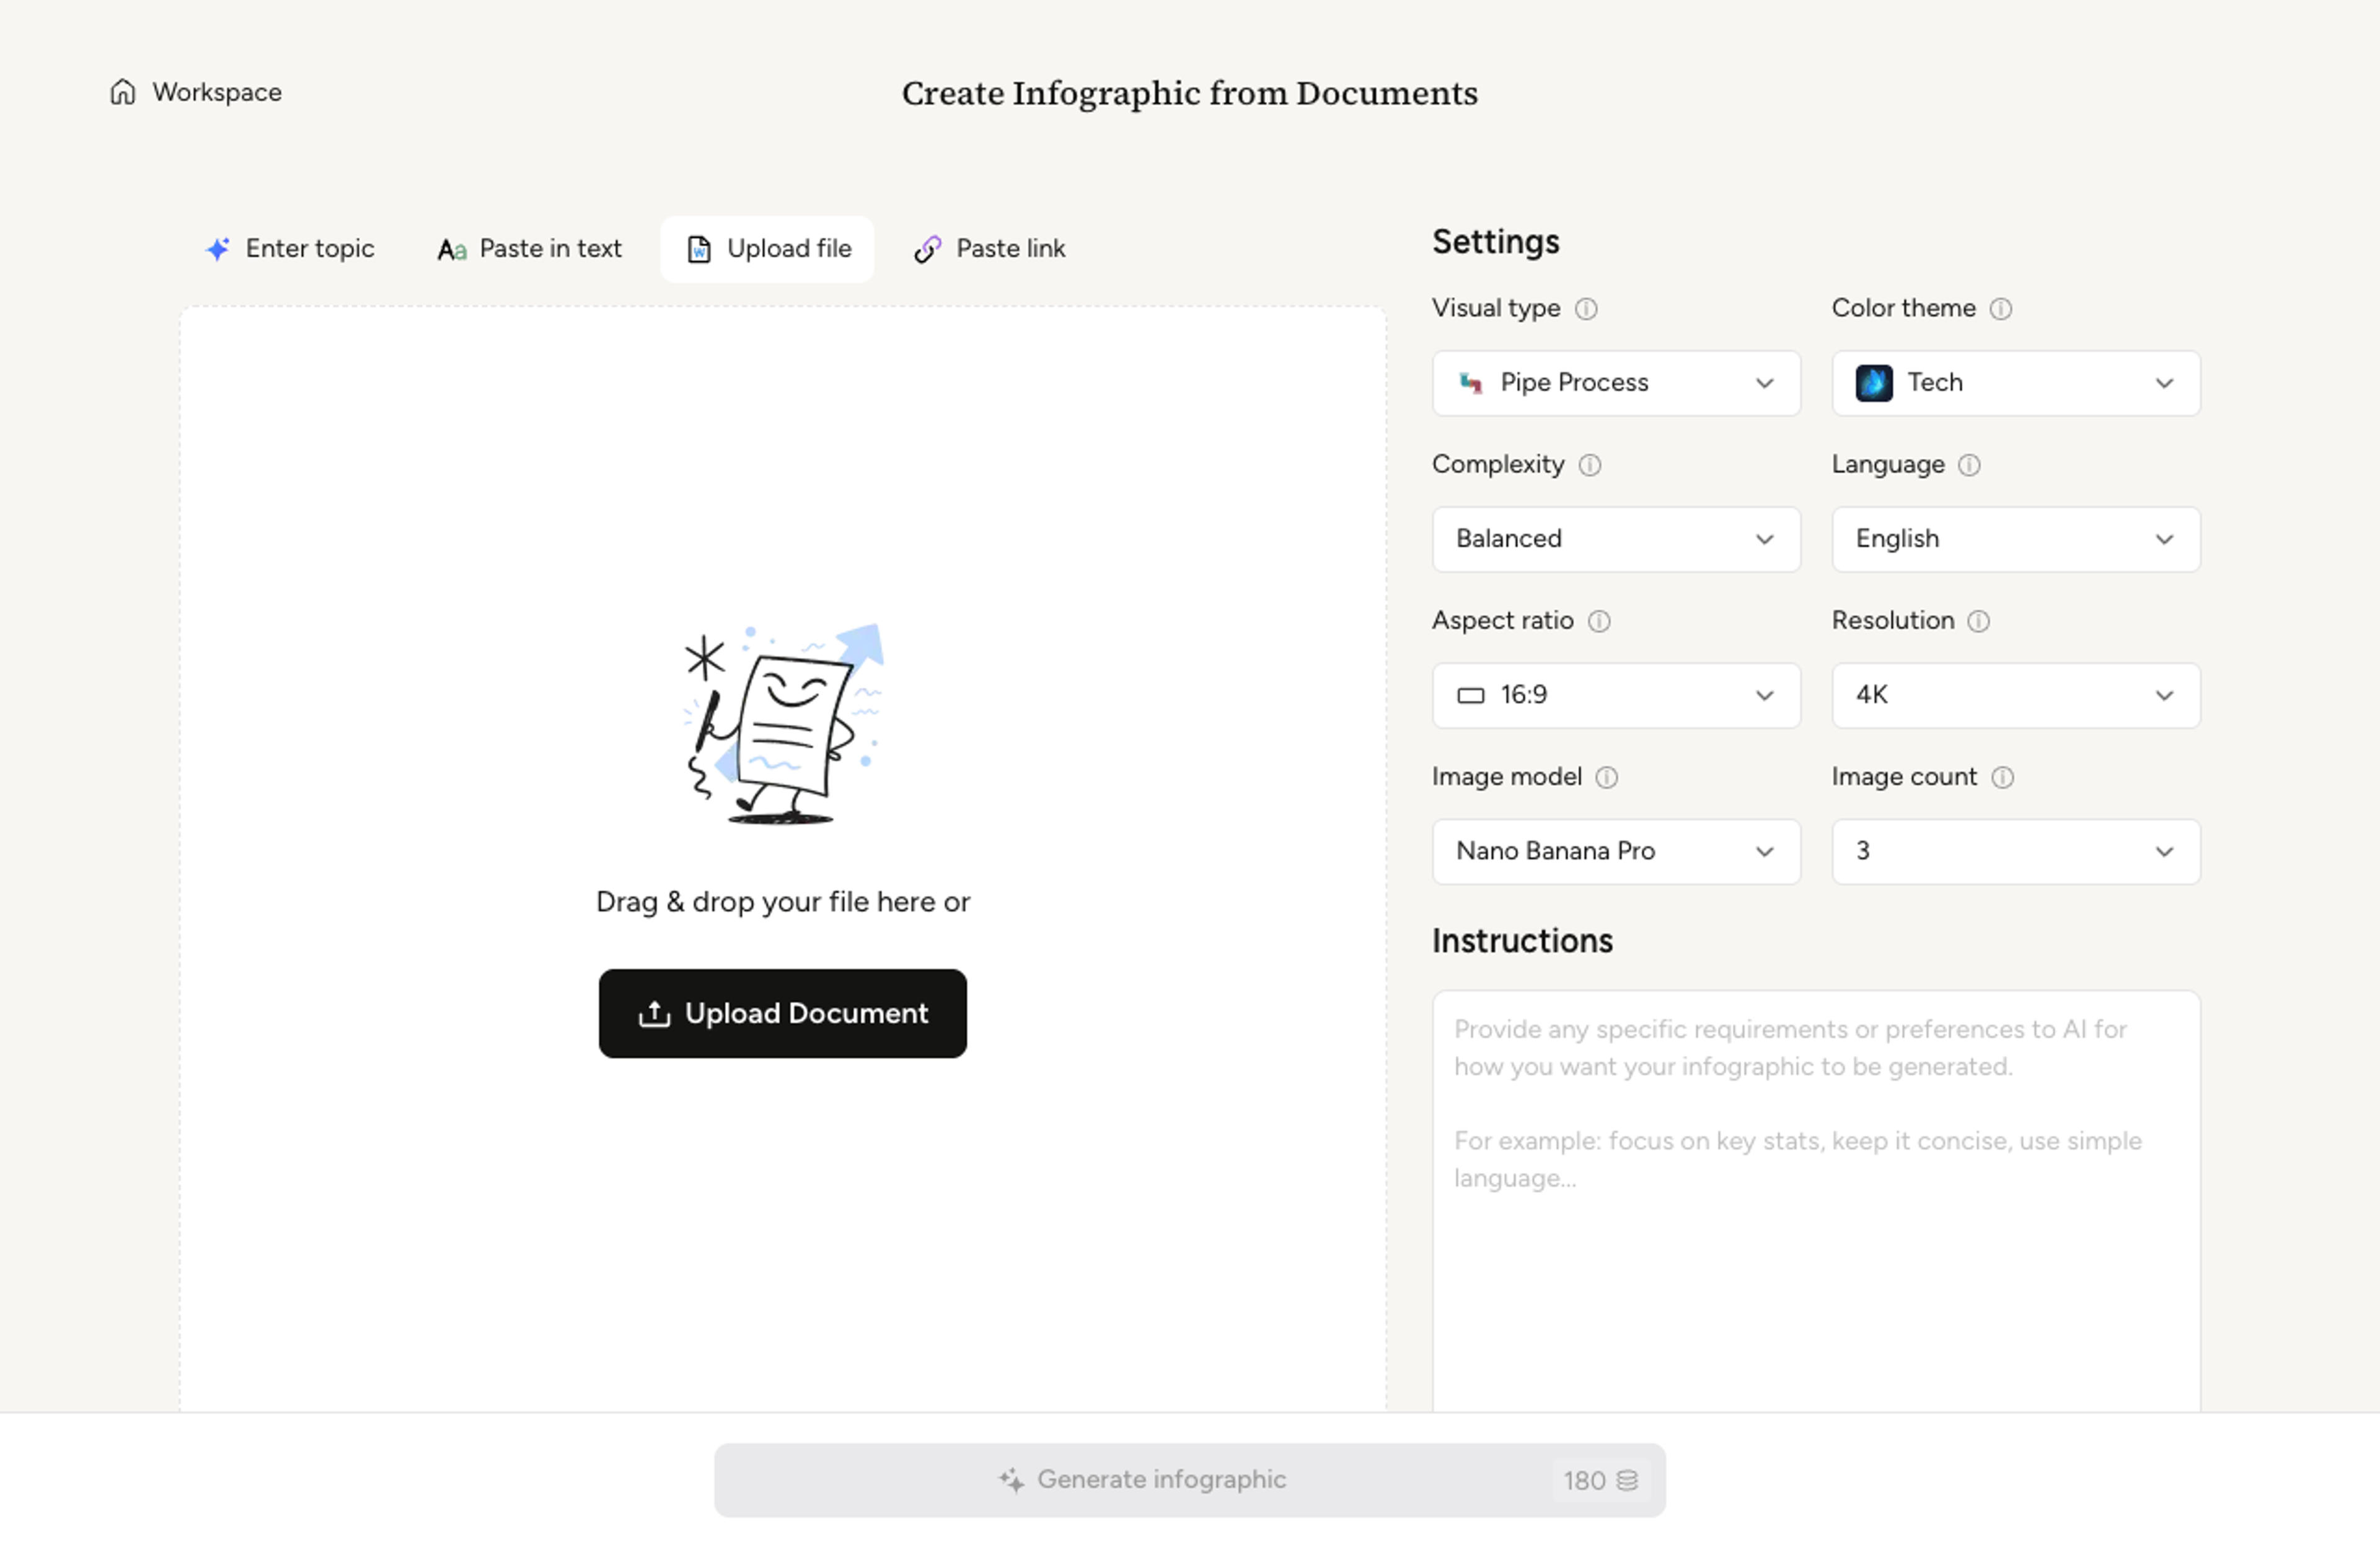
Upload a research paper, white paper, or report PDF and Infograph extracts the structure to render a clean infographic — no copy-paste between tools.
Drag and drop your document here or
Drop your PDF — research paper, white paper, internal report, or pitch document. The AI reads the body text, figures, and tables directly.
Pick a one-page summary, a multi-section infographic, or a poster-style layout. Infograph adapts the format to the density of your PDF.

The AI extracts headlines, supporting points, and any data callouts from the PDF, ranks the most important findings, and lays them out cleanly.

Tighten copy, swap a chart, or recolor a section with a single prompt. Export as PNG, JPG, or PDF for sharing online or printing for handouts.

Infograph.me transforms existing documents, links, text, topics, and data into polished infographics with professional styles, accurate text rendering, and AI-powered editing.
Upload documents, paste links, add raw text, input data, or start with a topic. Infograph.me turns each source into a structured visual story.
AI analyzes the original material, extracts key points, and preserves the logic of your content instead of generating generic visuals from a short prompt.
Create business, academic, education, marketing, consulting, and scientific infographics from the same content with style-appropriate layouts.
Generate professional scientific figures for research communication, papers, posters, lab reports, and technical explanations.
Turn tables, metrics, trends, and comparisons into charts, diagrams, and visual summaries that make complex data easier to understand.
Choose from mind maps, timelines, venn diagrams, comparisons, process flows, reports, visual summaries, and many other infographic formats.
Tell the AI exactly what to change. It can rewrite text, adjust hierarchy, modify layouts, add sections, and refine visuals directly.
Infograph.me is built for strong text rendering, readable labels, clean hierarchy, and polished information design.
Create high-quality visuals suitable for reports, presentations, classrooms, websites, social media, and professional documentation.
Yes. The AI reads body text, headings, captions, and table content. It ranks the most important findings so the infographic stays focused.
Research papers, white papers, internal reports, policy briefs, and pitch documents all work well. PDFs with text-based content convert better than scanned images.
The AI reads numerical findings in the text and rebuilds chart treatments to match. For original chart images, the AI recreates a clean version rather than embedding the raster.
Most PDFs convert in under a minute. Larger documents with many pages may take longer as the AI reads through the full source before composing the infographic.
Tables are converted into chart treatments, summary callouts, or a structured grid depending on the data. Use the table-to-infographic flow if your source is primarily tabular.
Describe two or three sets and Infograph will lay out a clean venn diagram with intersections, labels, and short captions ready for slides.
Paste an article, transcript, or batch of notes and Infograph turns the text into a polished infographic with hierarchy, callouts, and chart treatments.
Drop in a strategy doc or a business brief and Infograph will fill a clean SWOT template with strengths, weaknesses, opportunities, and threats.
Turn raw datasets, survey results, or research findings into a multi-chart statistical infographic that reads top-to-bottom like a narrative.
Turn strategy memos, planning sessions, or release notes into a roadmap visual that reads cleanly in stakeholder reviews and quarterly updates.
Turn frameworks like Maslow, Bloom's, or your own strategy stack into a clean pyramid chart that orders priorities at a glance.
Drop in a P&ID description, technical spec, or system overview and Infograph composes a clean pipe process diagram with named units and flow direction.
Drop in a market brief or a strategy memo and Infograph will compose a clean PESTLE analysis covering political, economic, social, technological, legal, and environmental factors.
Drop in meeting transcripts, research notes, or a single topic and Infograph builds a clean radial mind map you can iterate on.
Frame an innovation brief, brainstorming notes, or a strategy memo as a clean light bulb infographic that lands the core idea in a single visual.
Turn documents, links, text, and data into editable infographics instantly. ⭐ AI Infographic Generator | Built for fast, high-quality visual storytelling