

Step 1: Paste Your Text
Drop in an article, a meeting transcript, or pages of notes. The AI reads the full text instead of working from a single short prompt.
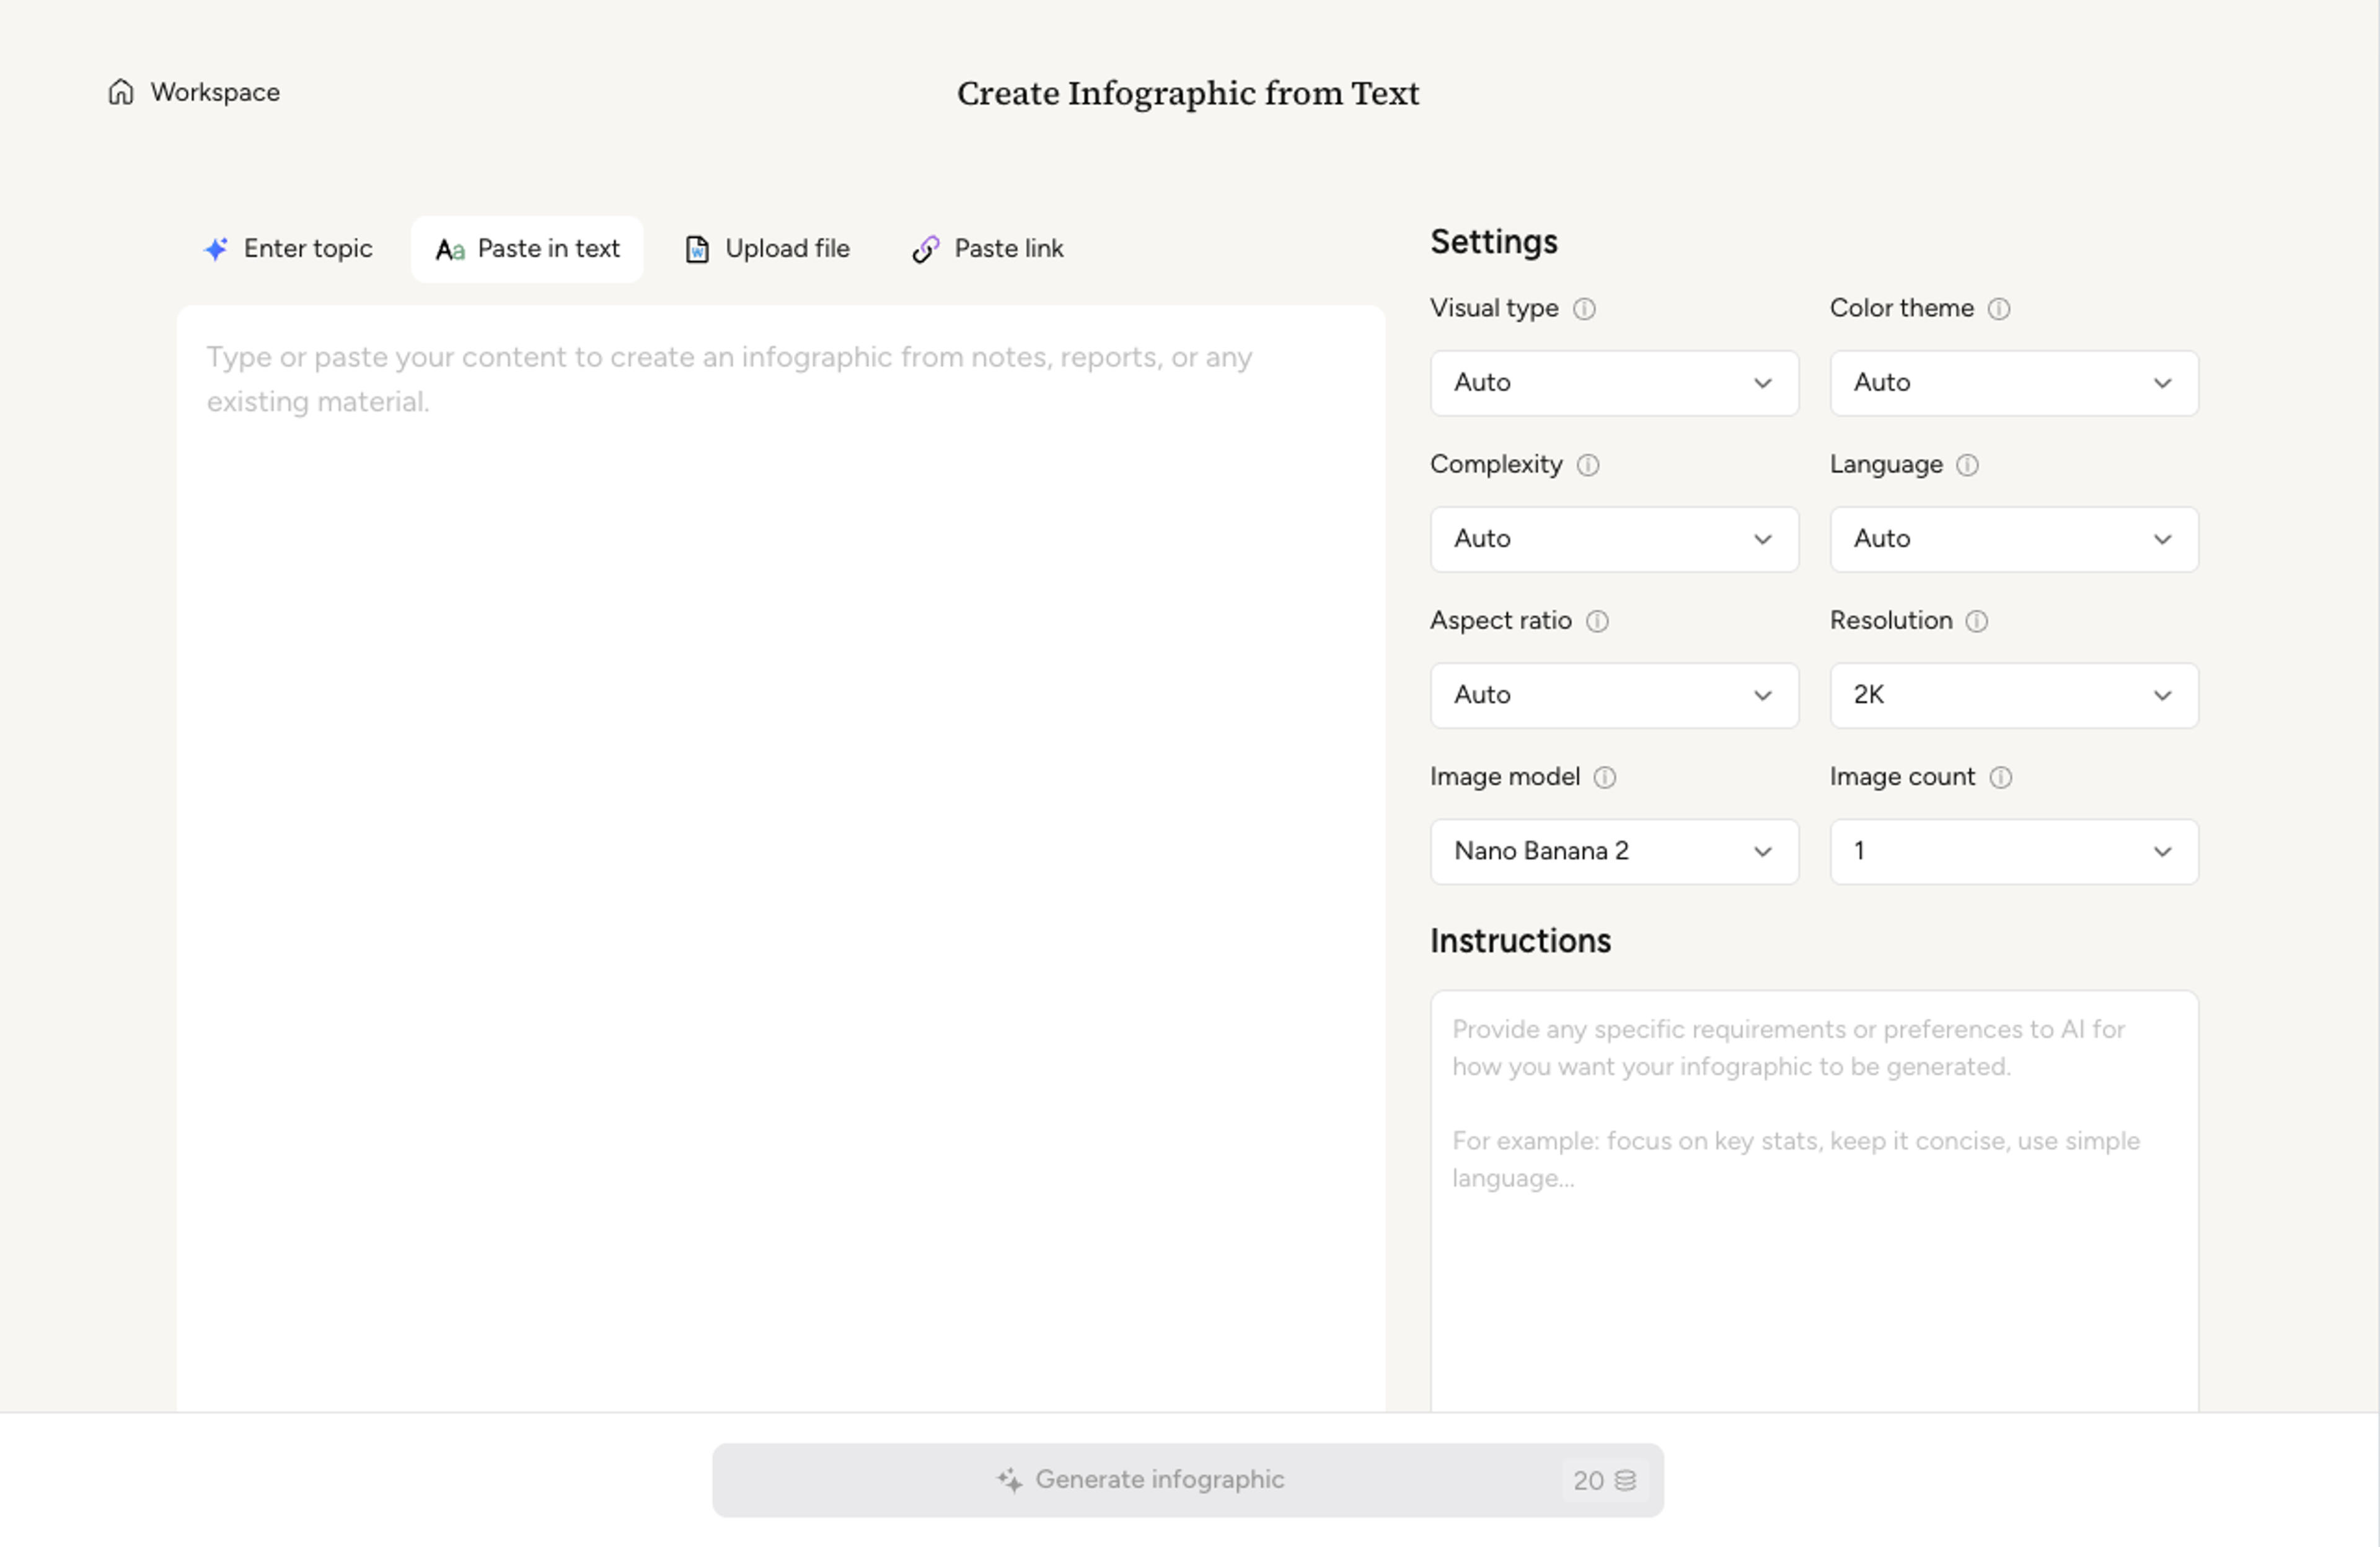
Paste an article, transcript, or batch of notes and Infograph turns the text into a polished infographic with hierarchy, callouts, and chart treatments.
Drag and drop your document here or
Drop in an article, a meeting transcript, or pages of notes. The AI reads the full text instead of working from a single short prompt.
Choose a one-page summary, a multi-section infographic, or a step-by-step format. The AI suggests a default based on how your text is structured.

Infograph identifies the headline insight, supporting points, and any quotable callouts. It lays them out with consistent typography and clear hierarchy.

Tighten copy, swap a chart, or recolor a section with a quick prompt. Export as PNG, JPG, or PDF for blog posts, decks, or printed handouts.

Infograph.me transforms existing documents, links, text, topics, and data into polished infographics with professional styles, accurate text rendering, and AI-powered editing.
Upload documents, paste links, add raw text, input data, or start with a topic. Infograph.me turns each source into a structured visual story.
AI analyzes the original material, extracts key points, and preserves the logic of your content instead of generating generic visuals from a short prompt.
Create business, academic, education, marketing, consulting, and scientific infographics from the same content with style-appropriate layouts.
Generate professional scientific figures for research communication, papers, posters, lab reports, and technical explanations.
Turn tables, metrics, trends, and comparisons into charts, diagrams, and visual summaries that make complex data easier to understand.
Choose from mind maps, timelines, venn diagrams, comparisons, process flows, reports, visual summaries, and many other infographic formats.
Tell the AI exactly what to change. It can rewrite text, adjust hierarchy, modify layouts, add sections, and refine visuals directly.
Infograph.me is built for strong text rendering, readable labels, clean hierarchy, and polished information design.
Create high-quality visuals suitable for reports, presentations, classrooms, websites, social media, and professional documentation.
Most articles and transcripts up to a few thousand words convert well. For longer text, the AI summarizes sections to keep the infographic readable.
Yes. Paste a transcript or a batch of notes and the AI identifies themes, decisions, and quotes that belong on the visual.
Yes. The AI surfaces quotable lines as callouts. You can pin a quote so it always appears in the final visual.
The AI keeps your phrasing where the text is already concise. For dense paragraphs it offers a tighter rewrite that you can accept or override.
Export as PNG or JPG for blog posts and social, or PDF for printed handouts and conference materials.
Describe two or three sets and Infograph will lay out a clean venn diagram with intersections, labels, and short captions ready for slides.
Drop in a strategy doc or a business brief and Infograph will fill a clean SWOT template with strengths, weaknesses, opportunities, and threats.
Turn raw datasets, survey results, or research findings into a multi-chart statistical infographic that reads top-to-bottom like a narrative.
Turn strategy memos, planning sessions, or release notes into a roadmap visual that reads cleanly in stakeholder reviews and quarterly updates.
Turn frameworks like Maslow, Bloom's, or your own strategy stack into a clean pyramid chart that orders priorities at a glance.
Drop in a P&ID description, technical spec, or system overview and Infograph composes a clean pipe process diagram with named units and flow direction.
Drop in a market brief or a strategy memo and Infograph will compose a clean PESTLE analysis covering political, economic, social, technological, legal, and environmental factors.
Drop in meeting transcripts, research notes, or a single topic and Infograph builds a clean radial mind map you can iterate on.
Frame an innovation brief, brainstorming notes, or a strategy memo as a clean light bulb infographic that lands the core idea in a single visual.
Turn documents, web pages, raw notes, or a single topic into a polished infographic. Infograph reads your source instead of asking you to design from a blank canvas.
Turn documents, links, text, and data into editable infographics instantly. ⭐ AI Infographic Generator | Built for fast, high-quality visual storytelling