

Paper summaries
Paste an abstract or manuscript section and generate a concise visual summary.
Create graphical abstract drafts from papers, abstracts, methods, findings, and research notes.
Drag and drop your paper, lab notes, lesson material, or document here or
Summarize the problem, method, finding, and impact in one clear research visual.
Paste an abstract or manuscript section and generate a concise visual summary.
Show the study design, intervention, analysis, and key outcome in a single visual path.
Add callouts that explain why the finding matters for readers outside your lab.
Paste notes, upload a paper, add a link, or describe the graphical abstract maker you need. Infograph reads the context before it designs the visual.
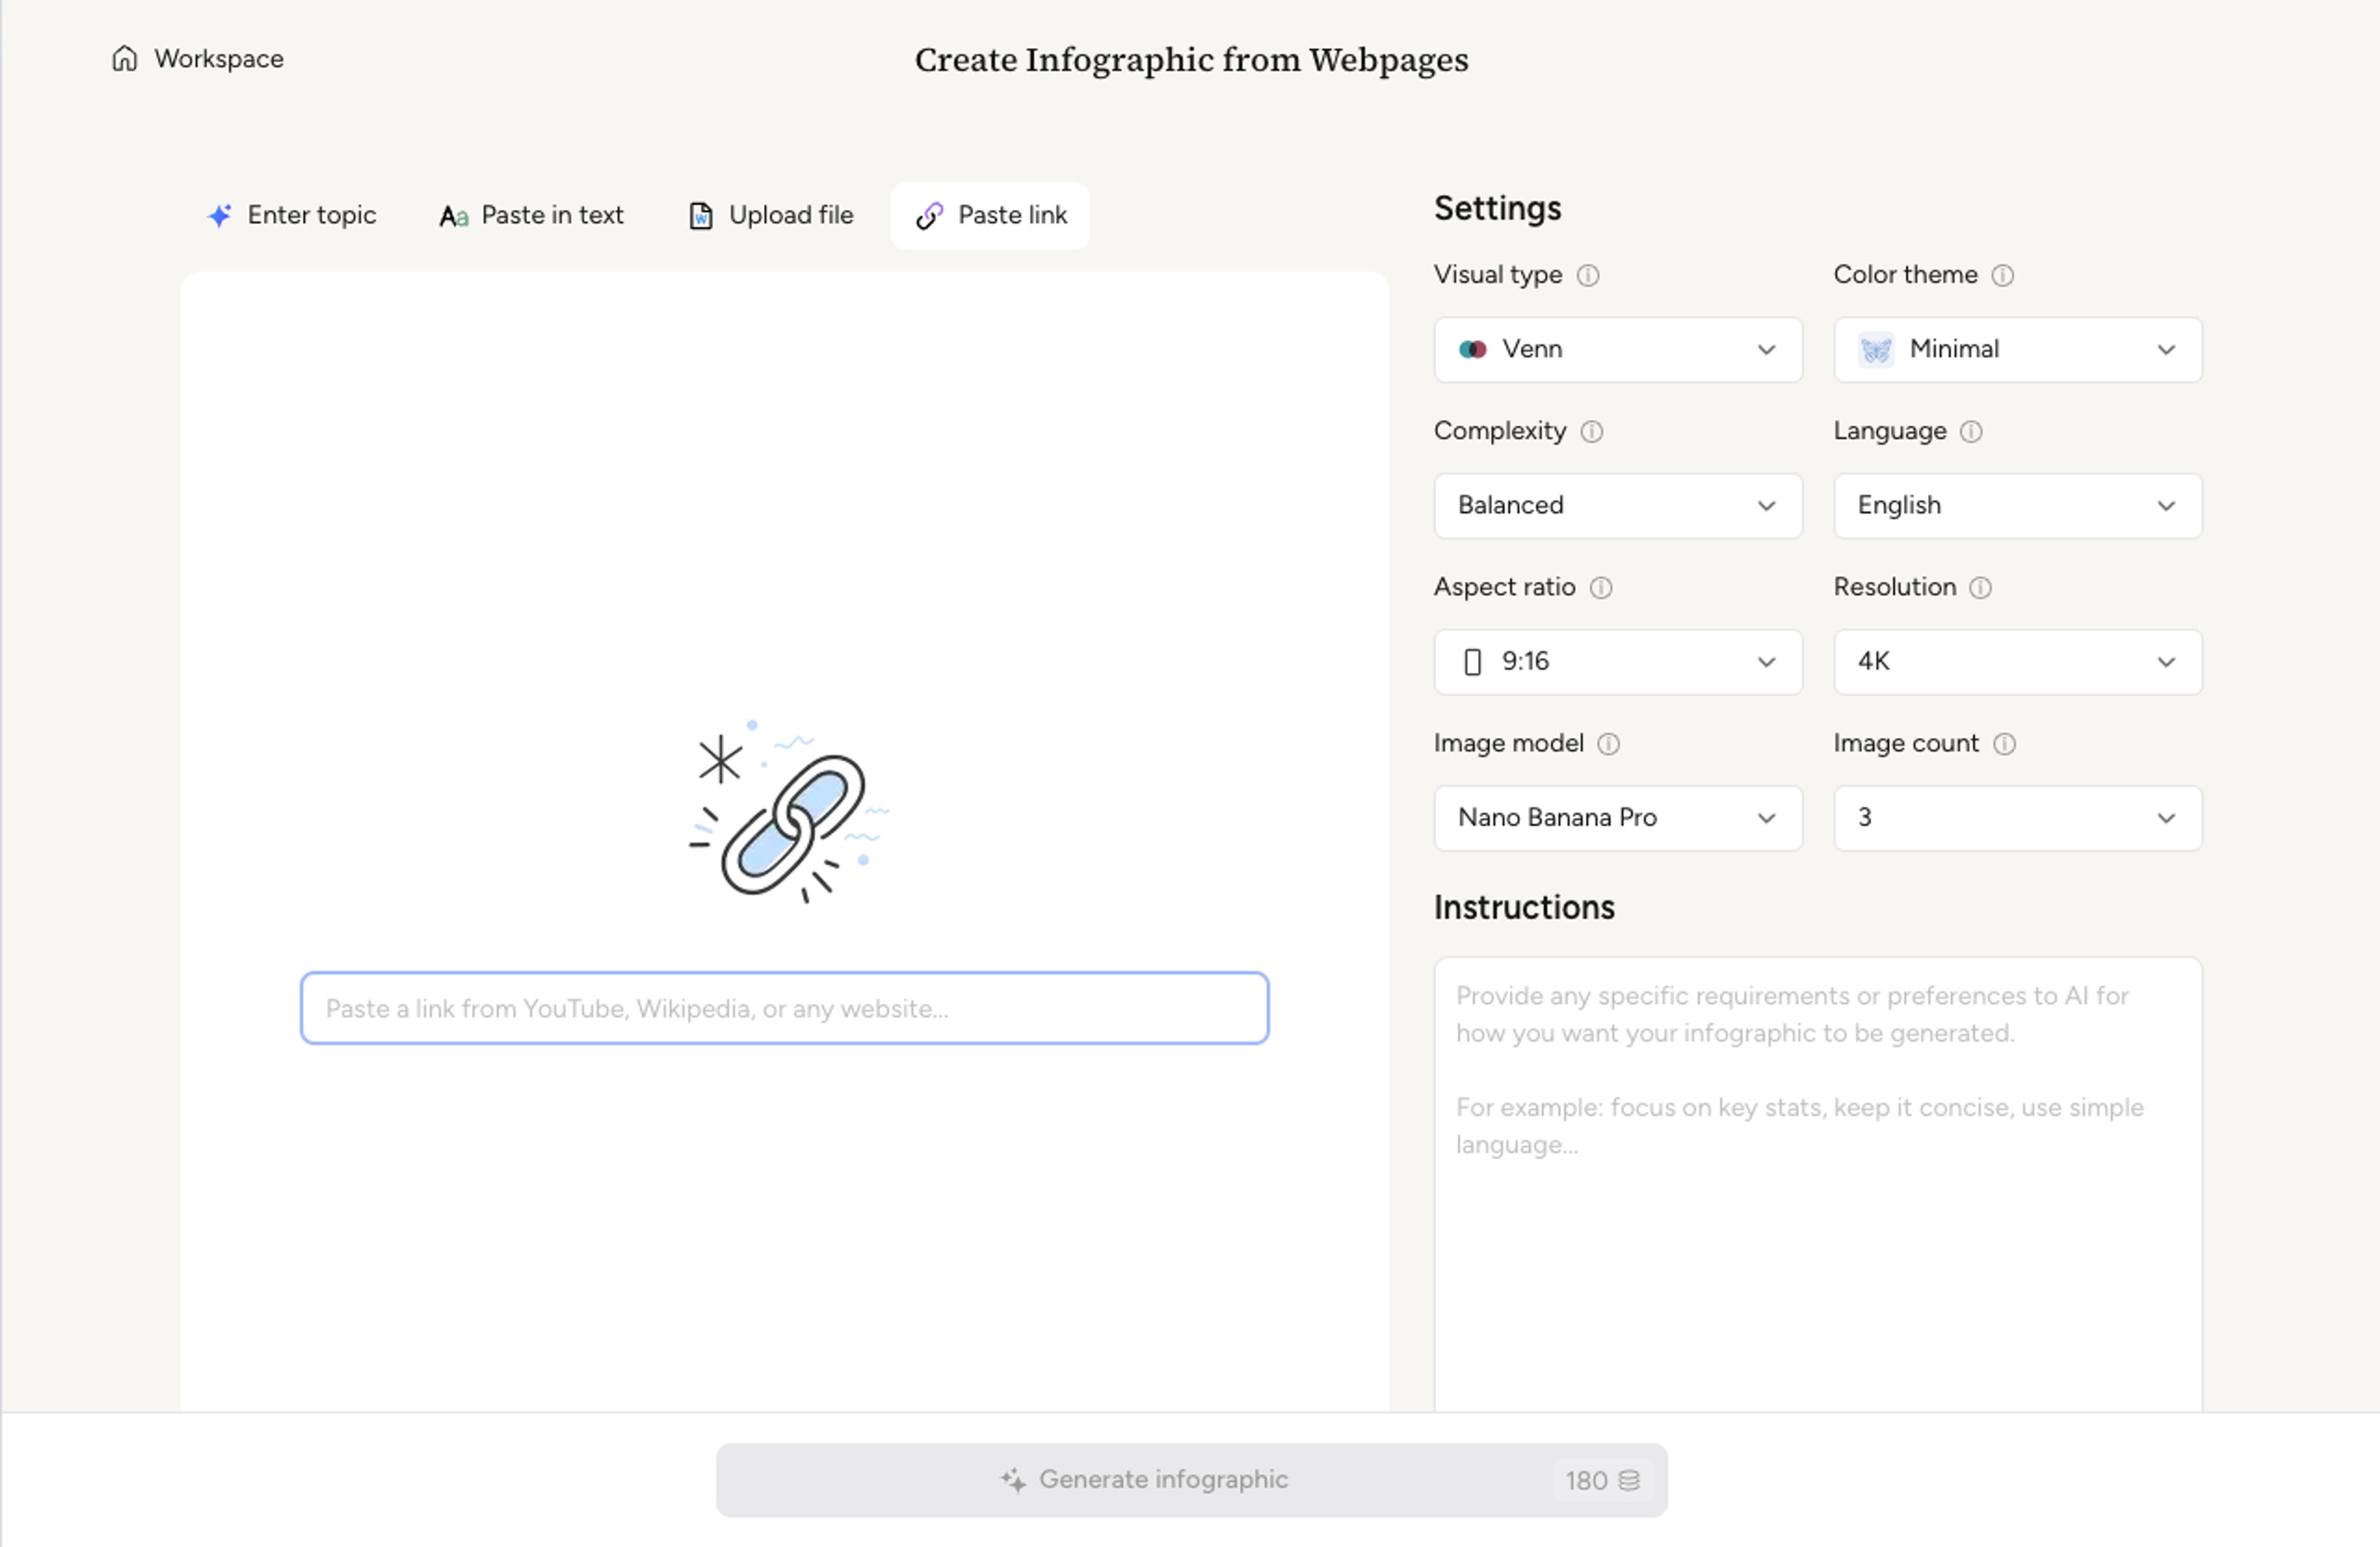
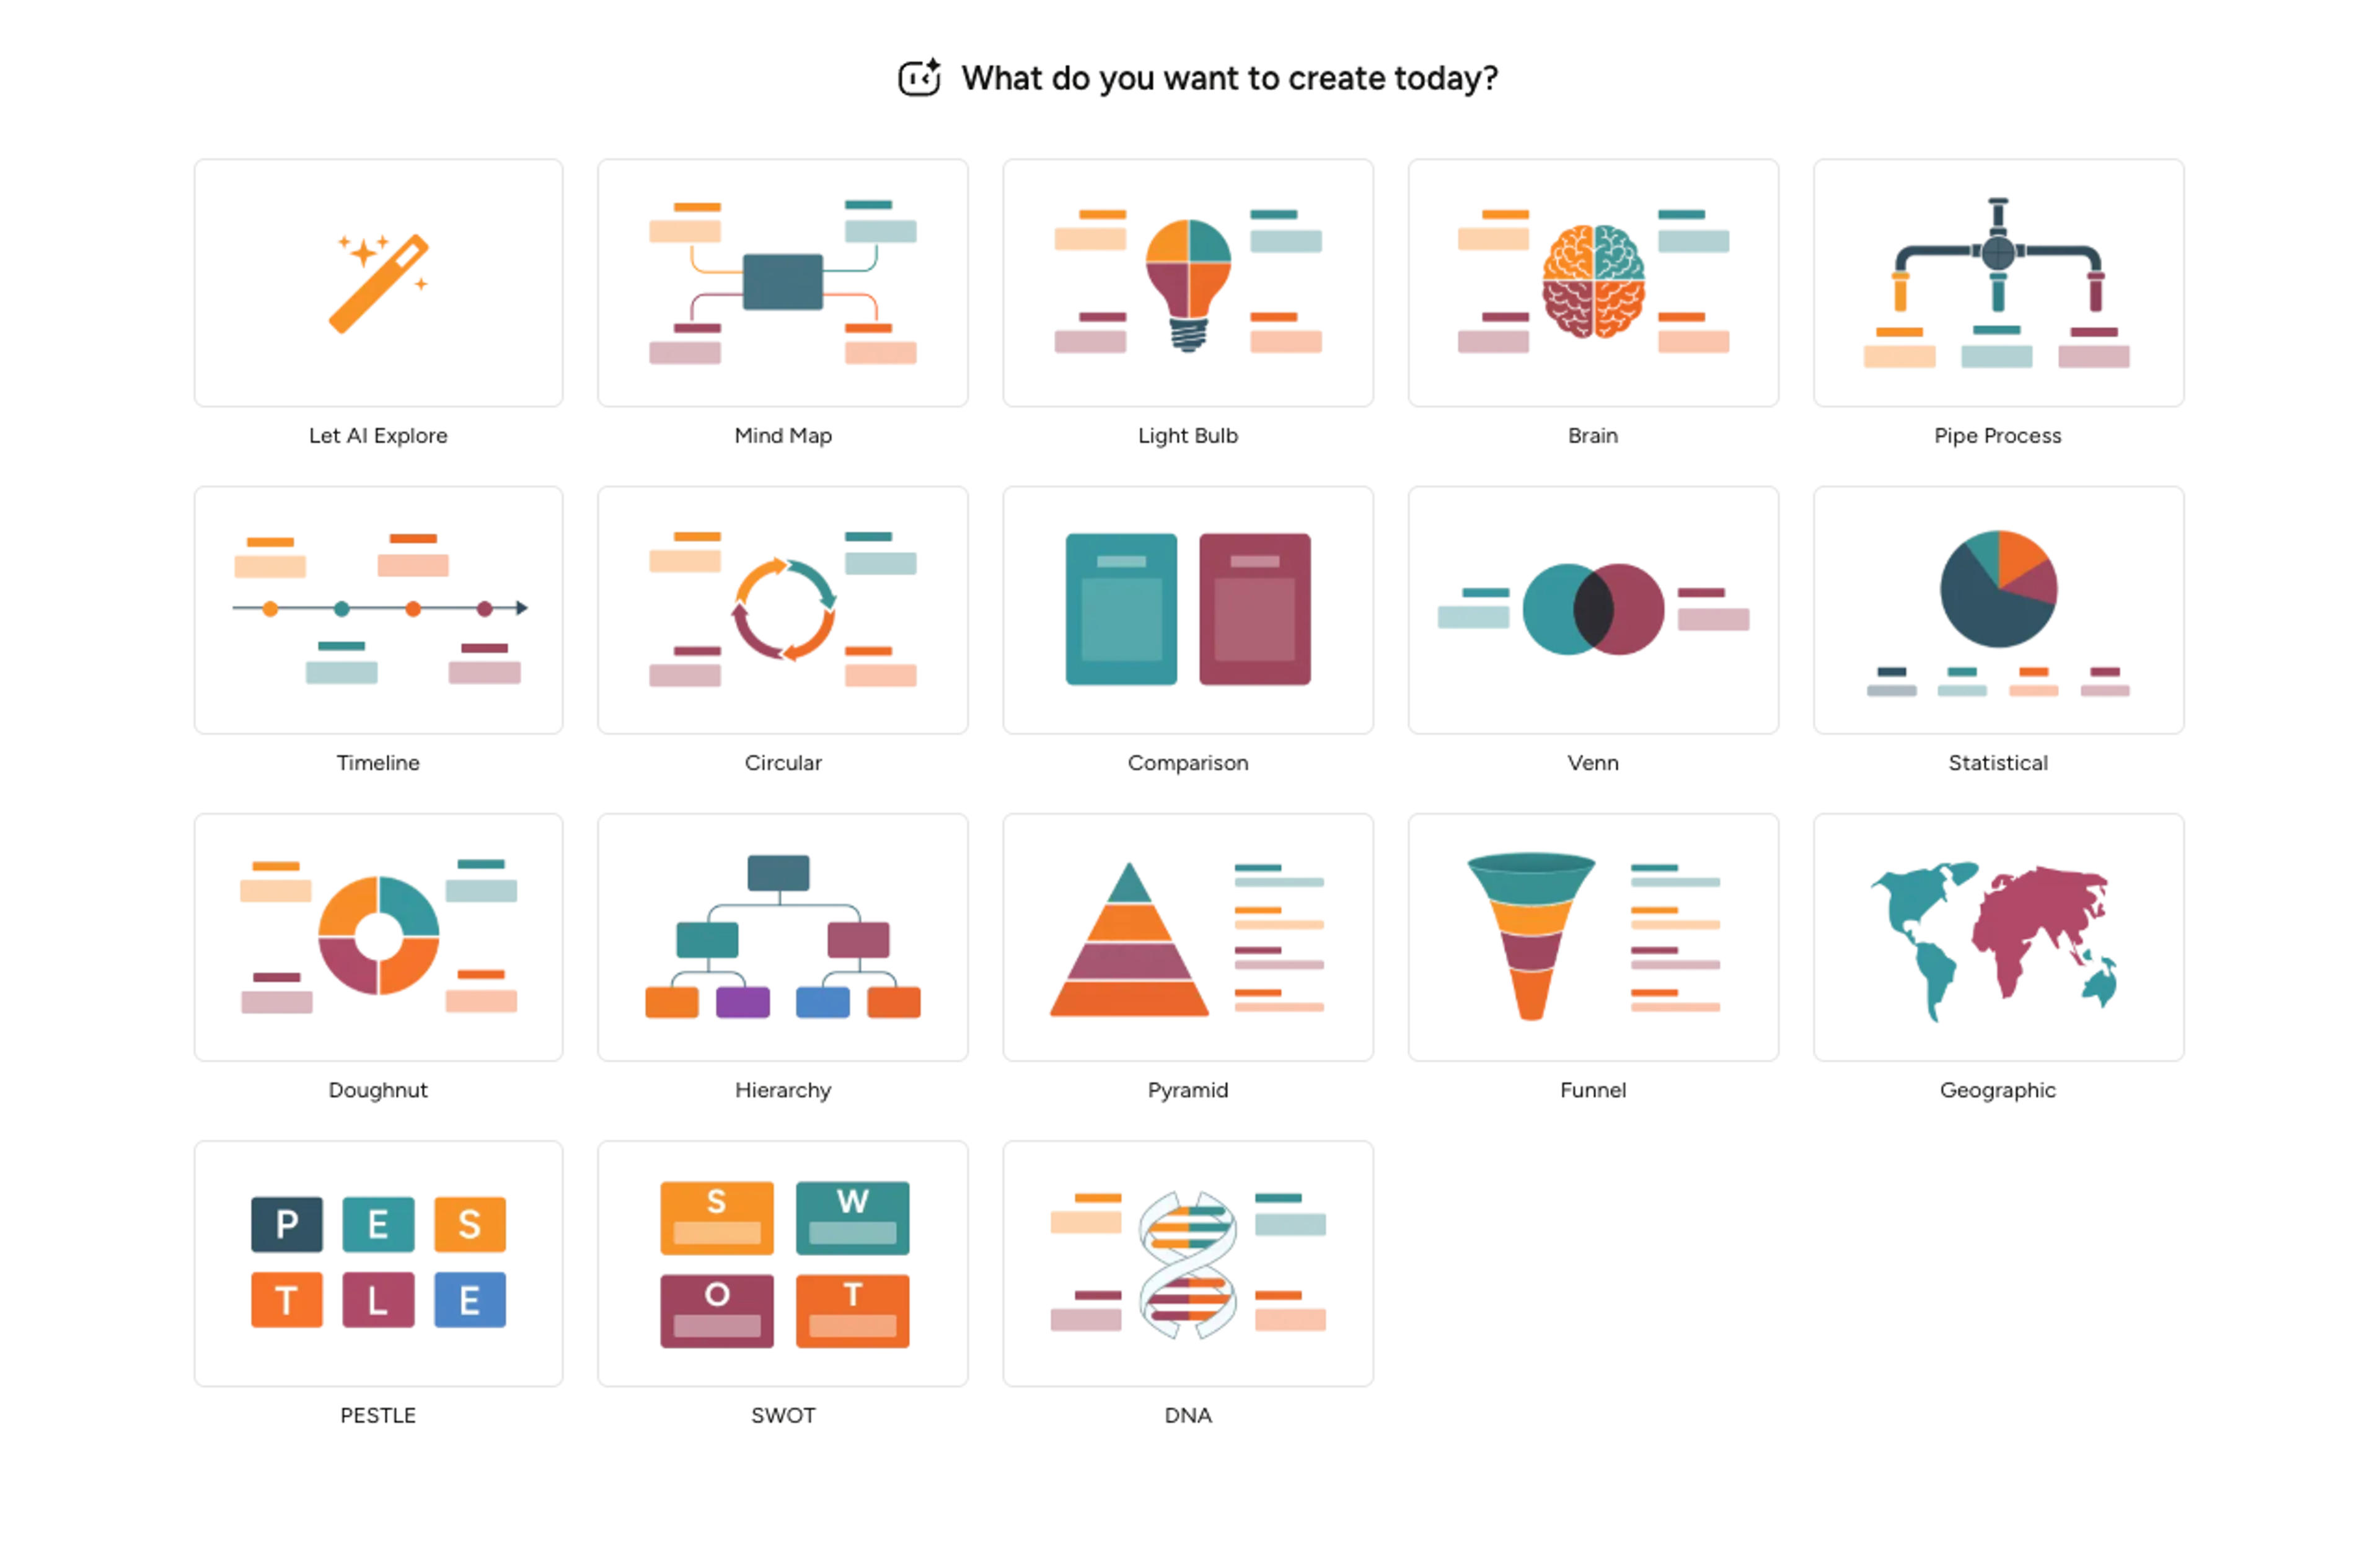
Choose the closest figure style or let AI decide whether the source needs a diagram, panel, timeline, flow, concept map, or infographic.
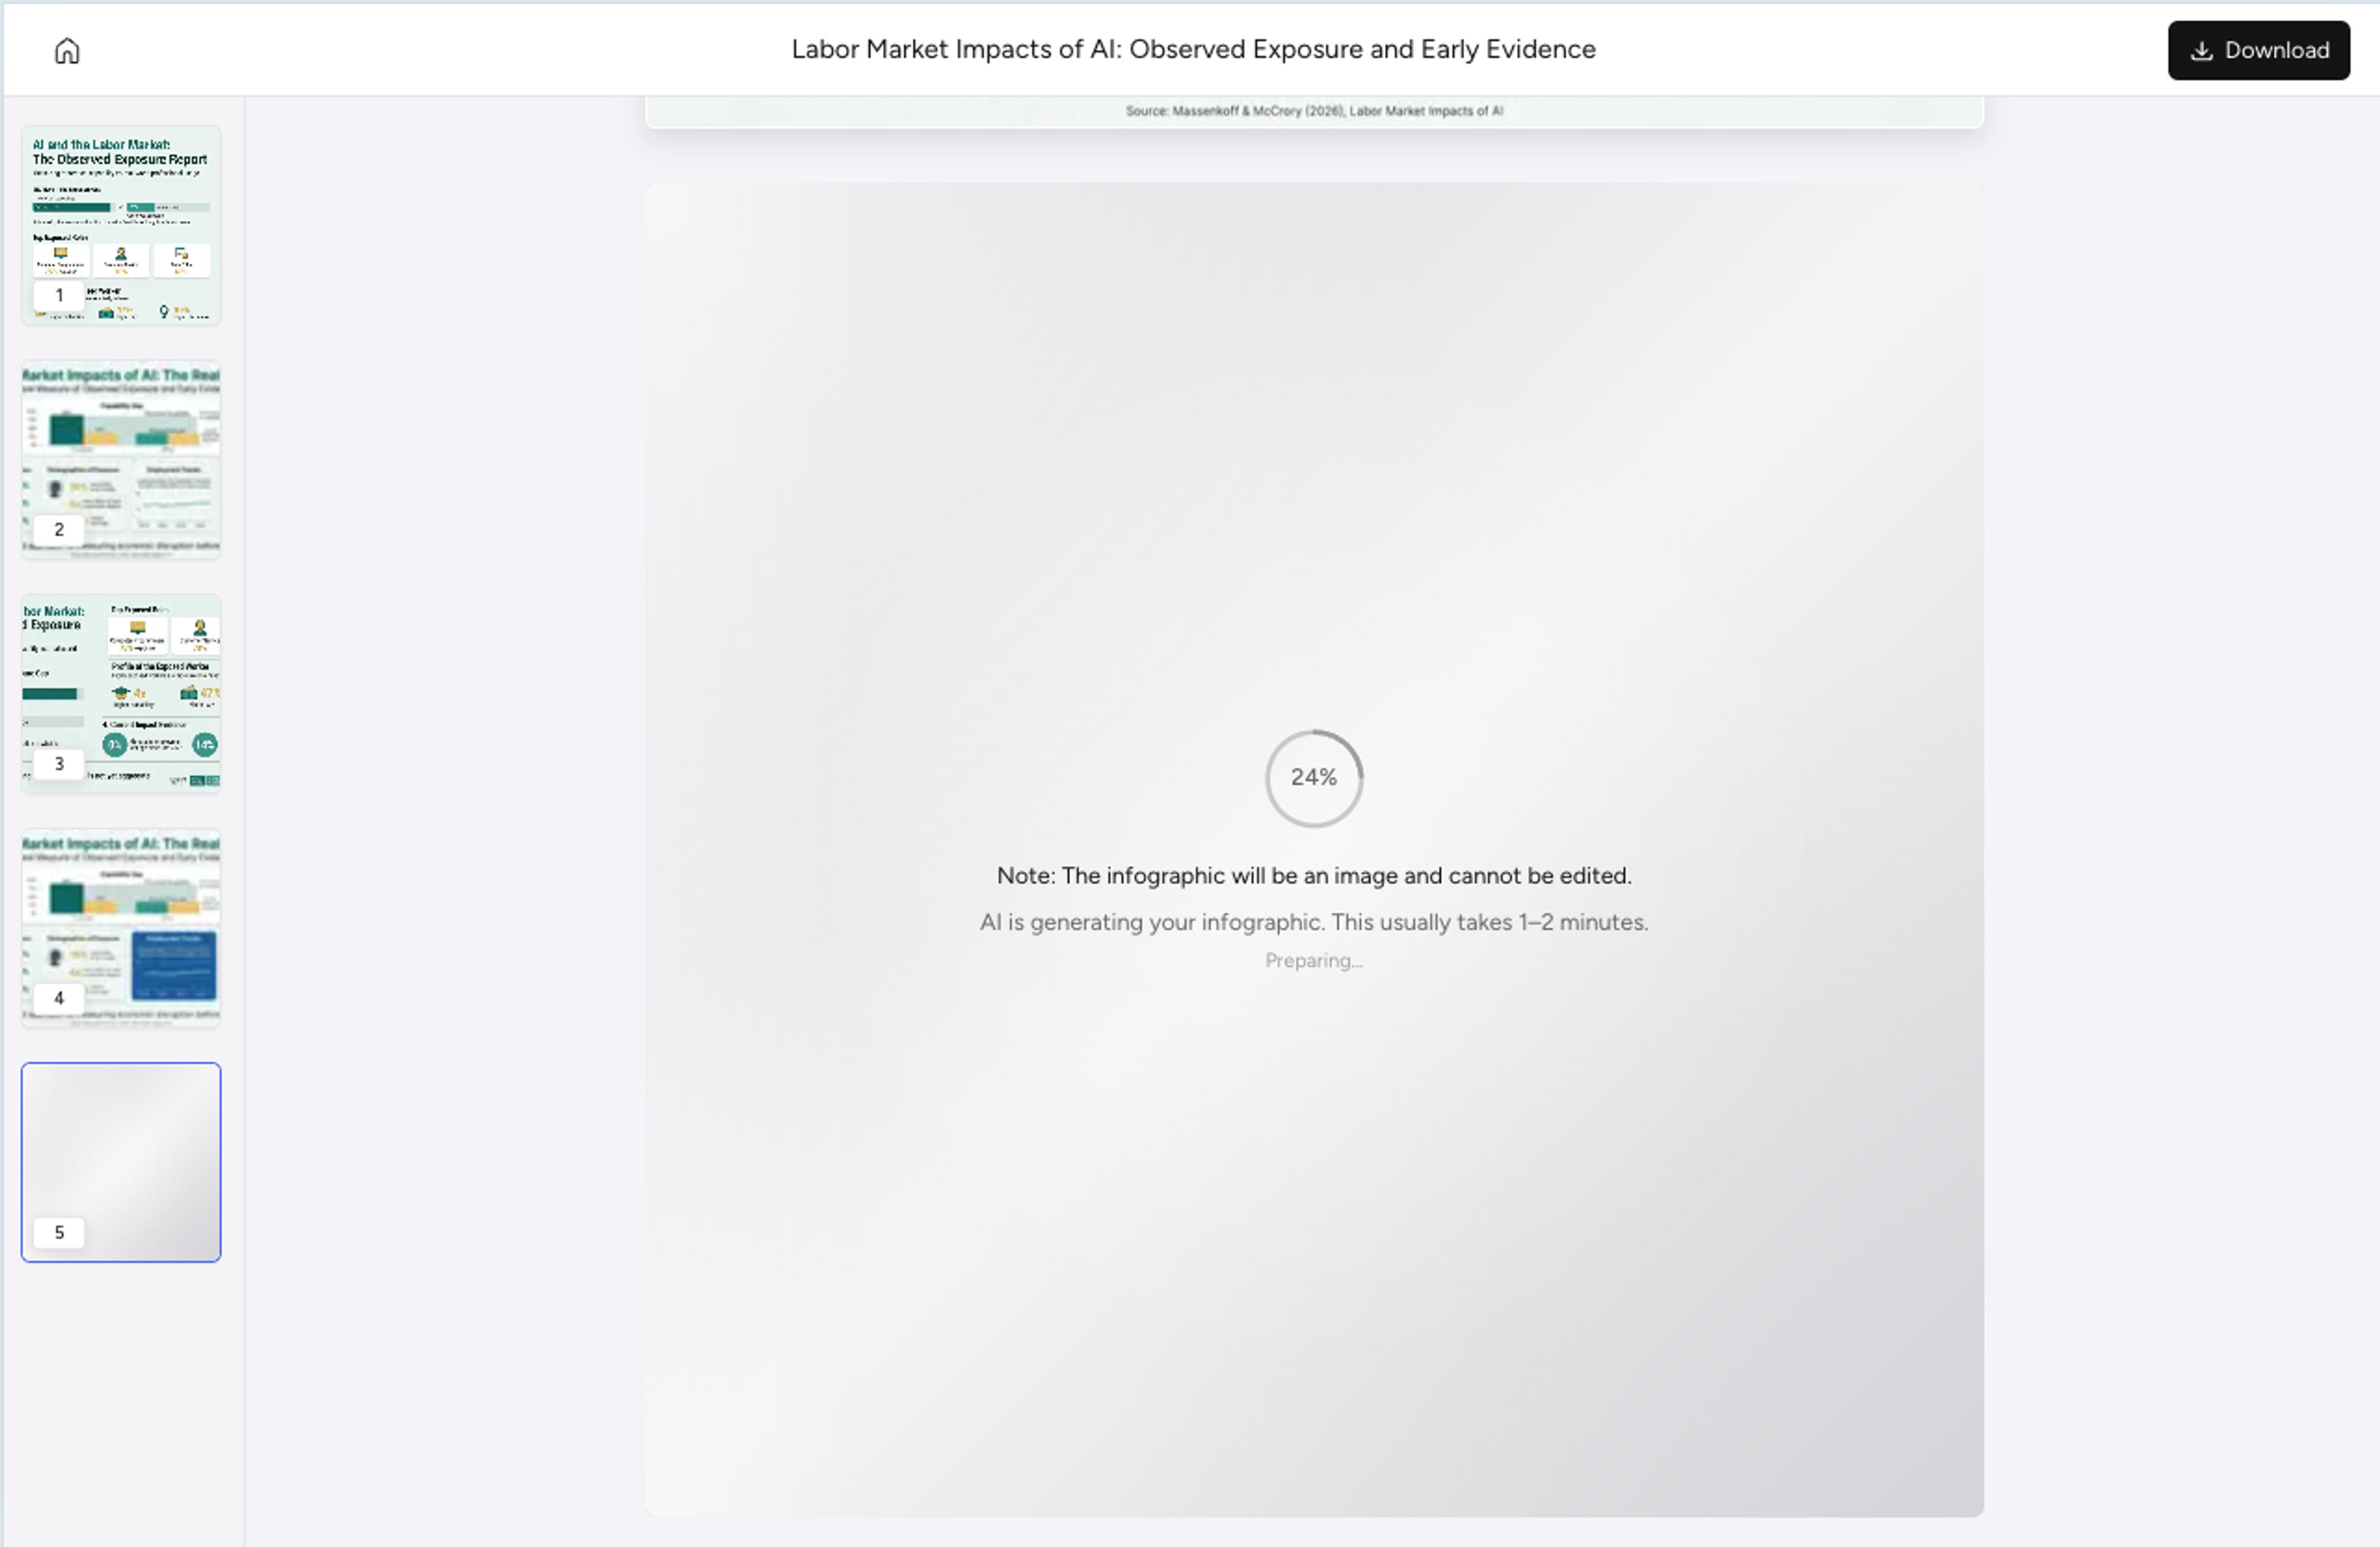
Infograph turns the source into labeled sections, hierarchy, captions, and readable visual structure so you are not starting from a blank canvas.
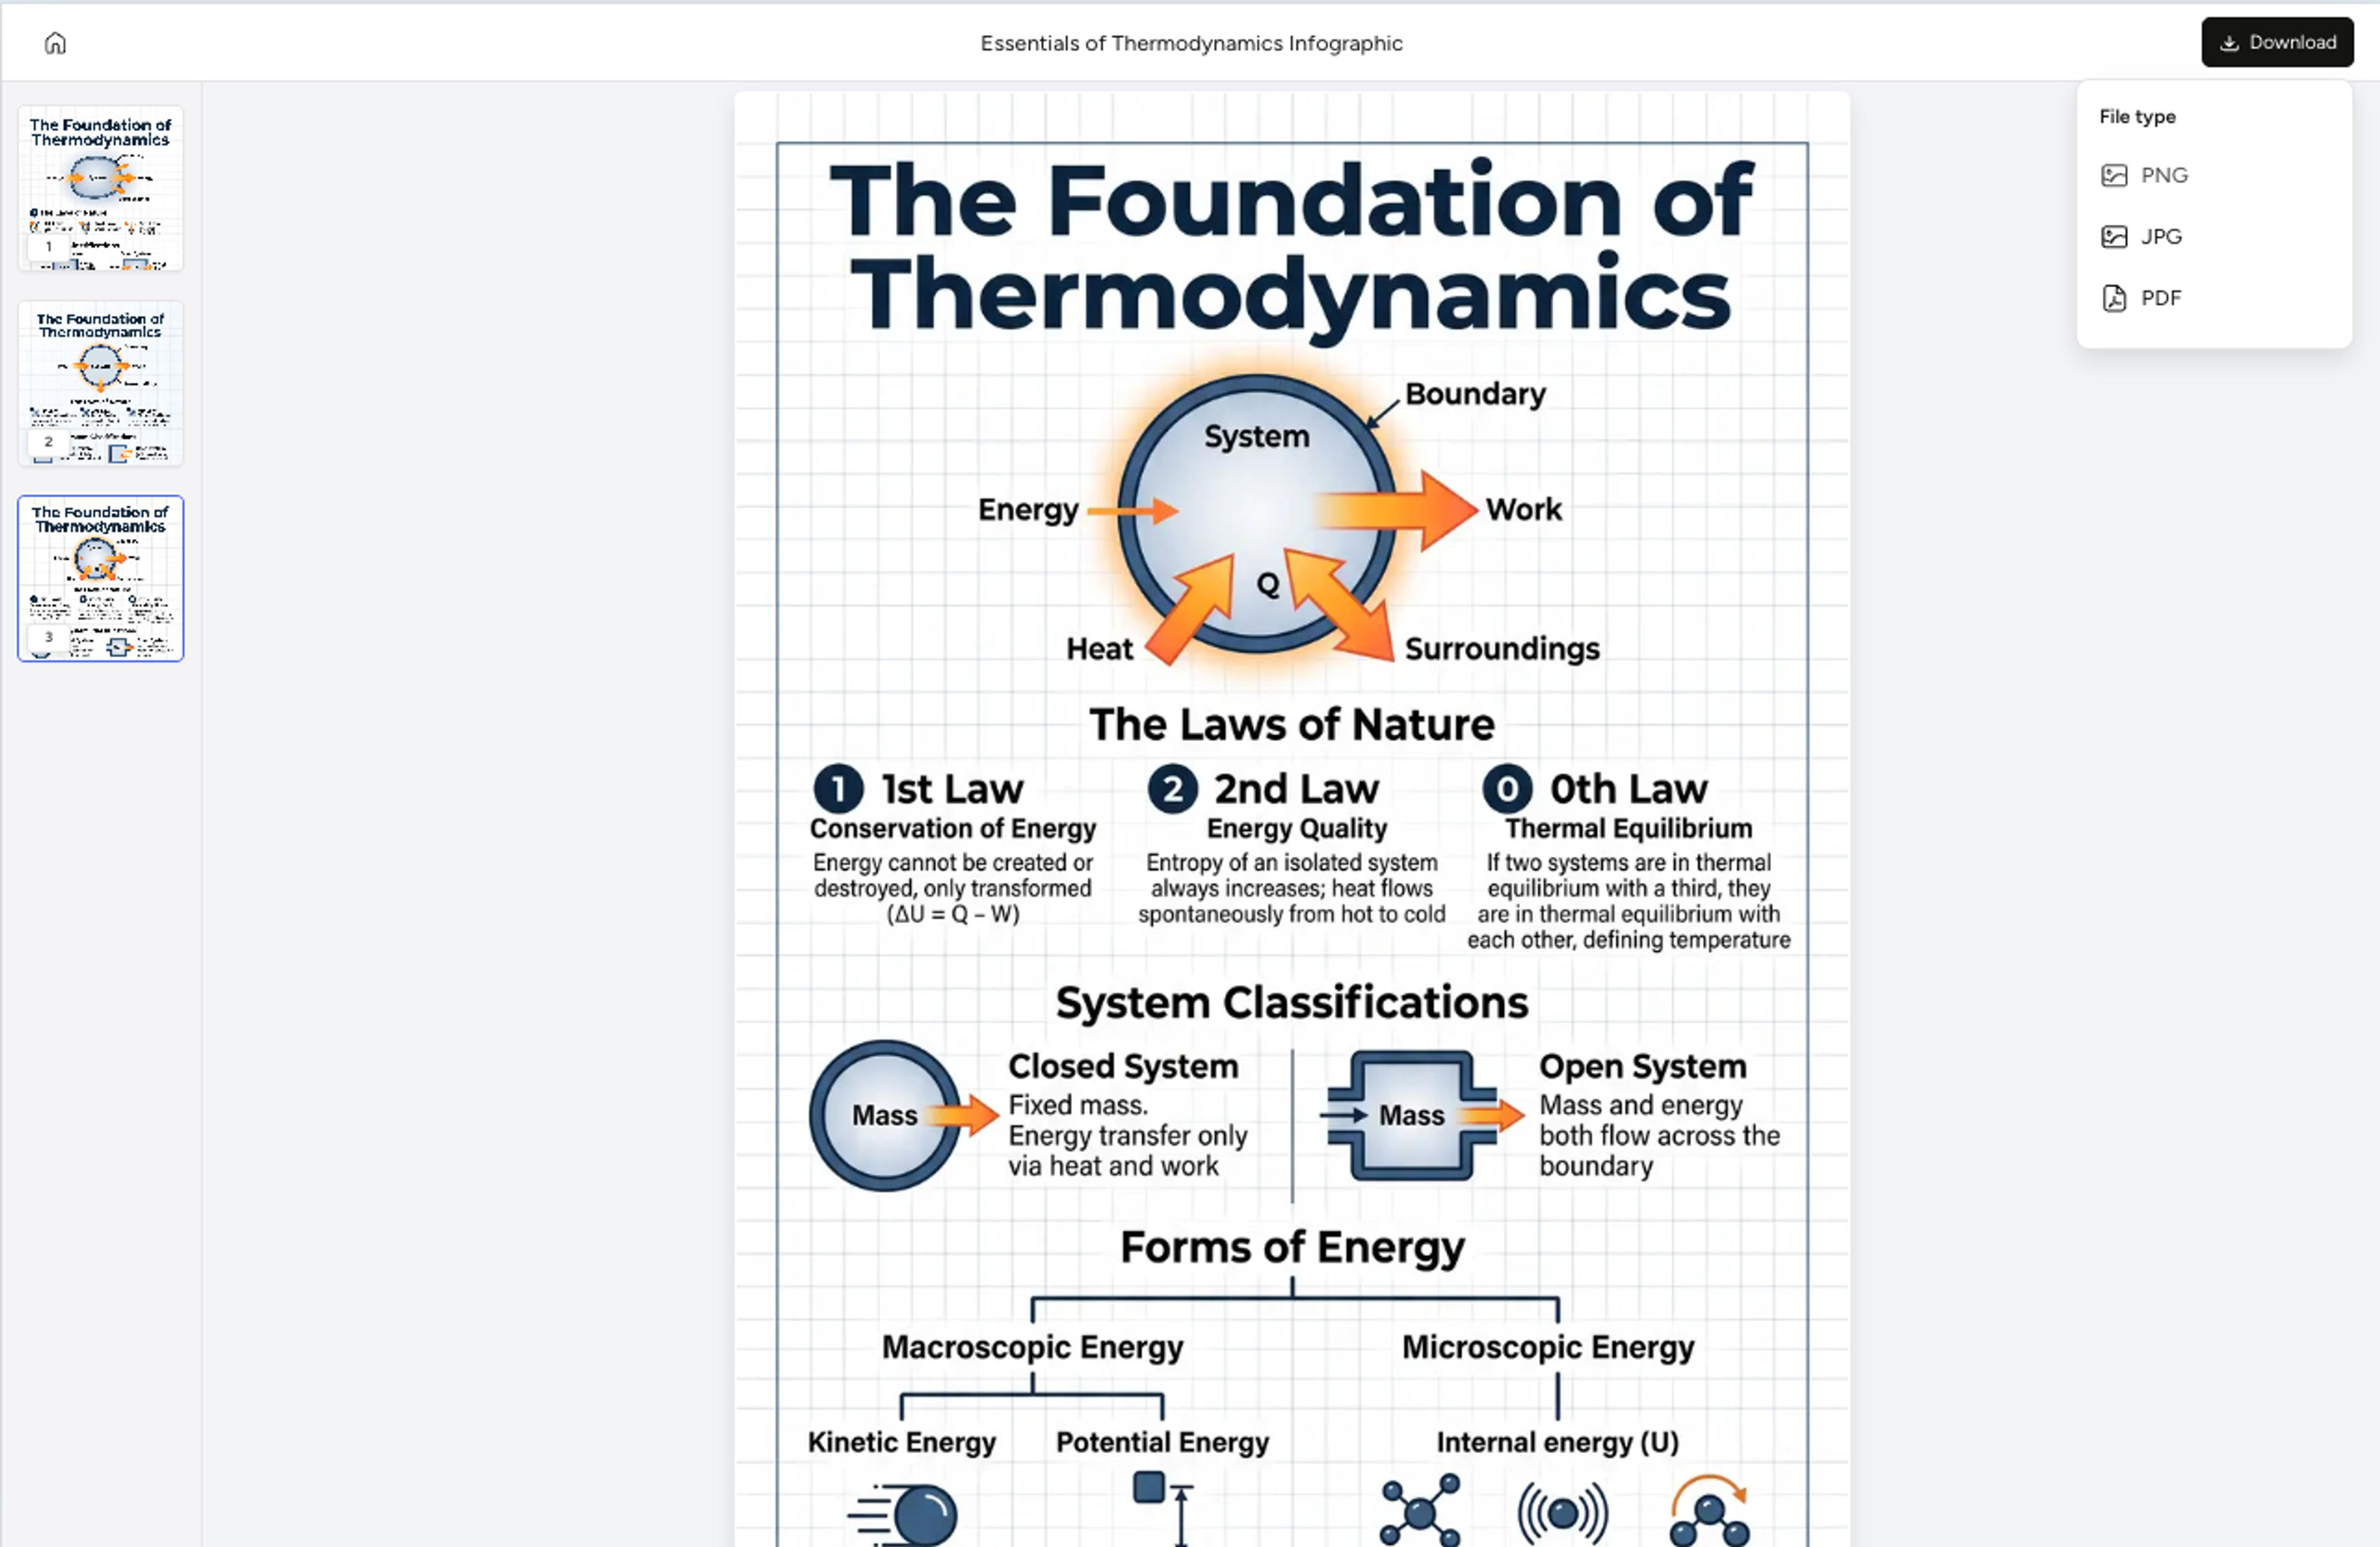
Ask AI to simplify labels, adjust layout, rewrite captions, or change emphasis, then export the final visual as PNG, JPG, or PDF.
Graphical abstracts need scientific clarity, not just decoration.
Convert dense abstracts into readable visual summaries.
Represent study design and workflow without overloading the figure.
Simplify for broad audiences or keep detail for academic readers.
Generate multiple angles before finalizing the story.
Yes. Paste the abstract, add notes, or upload a document to create a graphical abstract draft.
Yes. You can use longer source material, then refine the draft around the most important findings.
Yes. Graphical abstracts are useful for posters, talks, grant summaries, and paper promotion.
It can generate concise labels and caption-style text that you can review and edit.
Yes. Treat the output as a draft and verify claims, labels, units, and scientific details.
Continue with adjacent AI tools for scientific figures, research diagrams, and academic infographics.
Turn research notes, methods, data, and science topics into labeled scientific figure drafts with AI.
Generate clear scientific illustrations, concept diagrams, and explanation visuals from text, papers, links, and topics.
Turn research findings, methods, literature notes, and data into clear academic infographics.
Generate biology diagrams from topics, notes, papers, links, and classroom material with AI.
Turn notes, papers, lesson plans, and topics into concept maps that show ideas, links, hierarchy, and relationships.
Turn papers, lab notes, links, text, and data into scientific figures, graphical abstracts, biology diagrams, and research visuals. AI Scientific Figure Maker | Built for research and education