

Cell and organism diagrams
Create labeled visuals for cell structure, organs, systems, organisms, and classroom topics.
Generate biology diagrams from topics, notes, papers, links, and classroom material with AI.
Drag and drop your paper, lab notes, lesson material, or document here or
Turn biology content into labeled visuals for papers, posters, lectures, lab reports, and K-12 lessons.
Create labeled visuals for cell structure, organs, systems, organisms, and classroom topics.
Explain genes, DNA, proteins, signaling pathways, and mechanisms with structured diagrams.
Show protocols, variables, samples, controls, and outcomes in a clean visual sequence.
Paste notes, upload a paper, add a link, or describe the biology diagram maker you need. Infograph reads the context before it designs the visual.
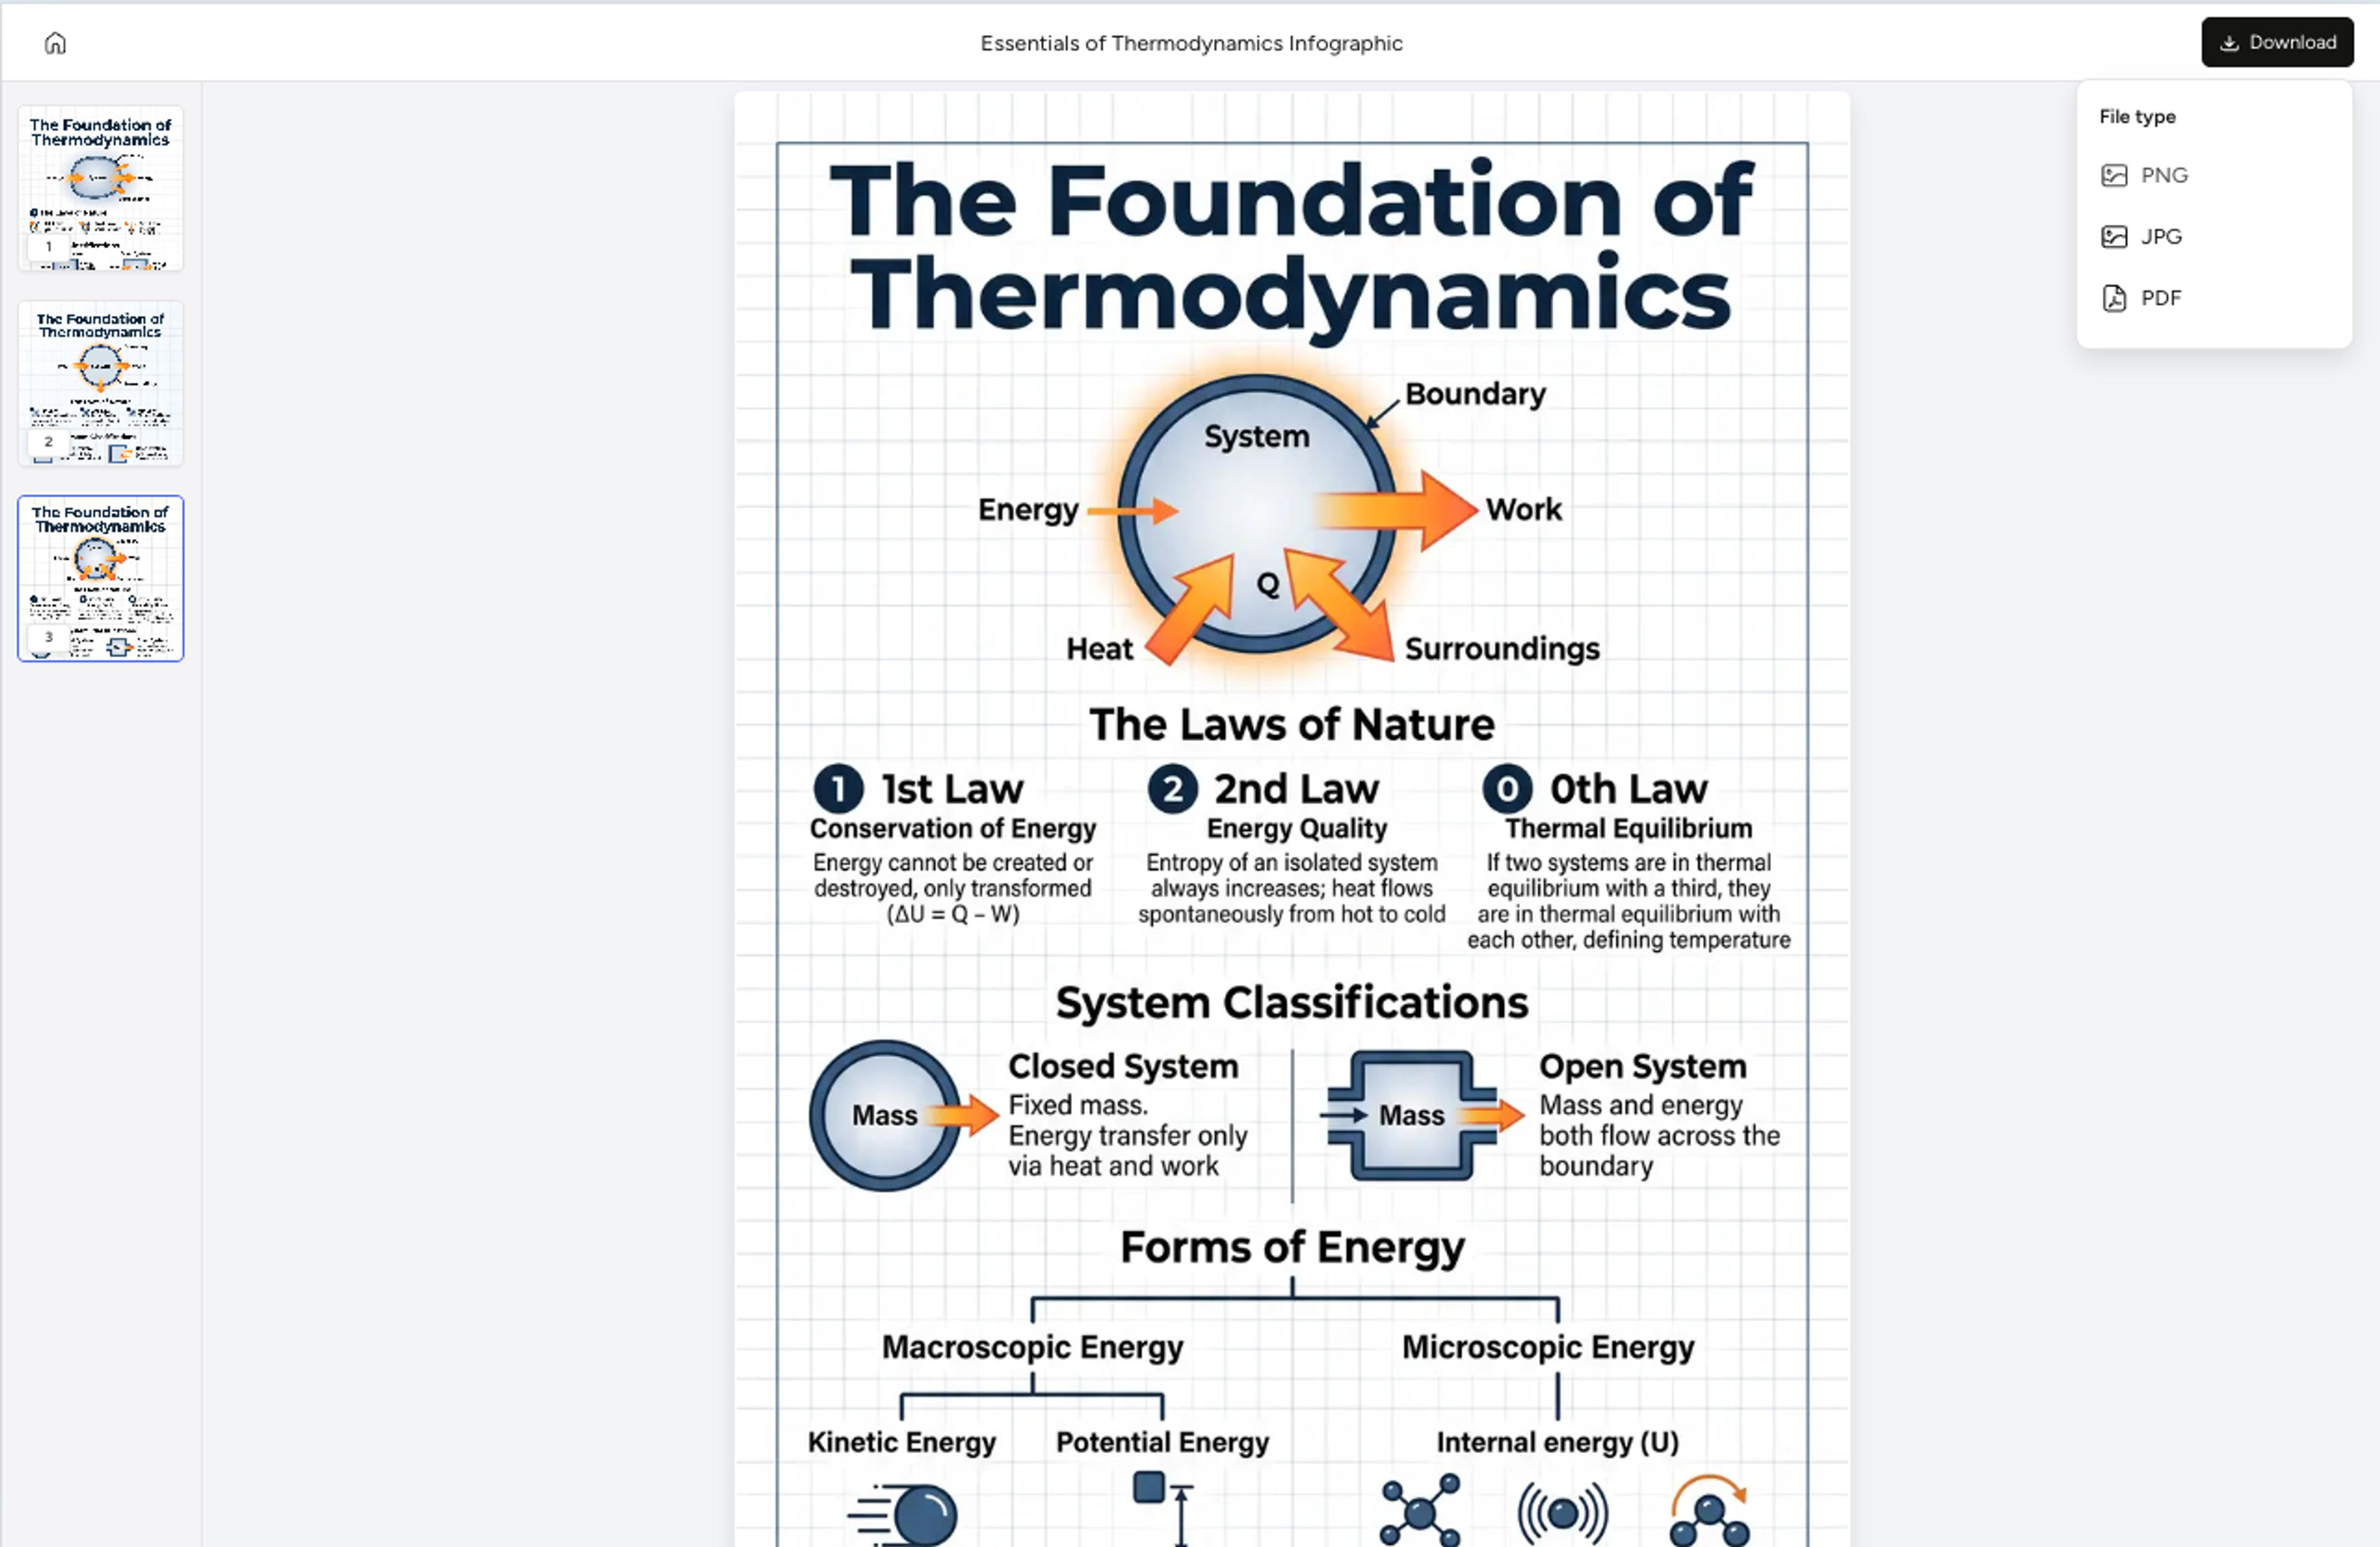
Choose the closest figure style or let AI decide whether the source needs a diagram, panel, timeline, flow, concept map, or infographic.
Infograph turns the source into labeled sections, hierarchy, captions, and readable visual structure so you are not starting from a blank canvas.
Ask AI to simplify labels, adjust layout, rewrite captions, or change emphasis, then export the final visual as PNG, JPG, or PDF.
Use the source-to-figure workflow for classroom diagrams and research communication.
Start from a biology topic, paper, lesson, or lab note.
Generate labels that make structures and relationships easier to follow.
Simplify diagrams for K-12 and university teaching.
Create mechanism, methods, and pathway figure drafts.
Cell diagrams, DNA visuals, pathway diagrams, anatomy explainers, experiment workflows, and classroom biology graphics.
Yes. Teachers can generate simpler diagrams and infographics for lessons, worksheets, and presentations.
Yes. Paste sections, upload documents, or add links so the diagram is based on your source material.
Yes. You can describe the pathway and ask for labels, steps, and callouts.
Yes. Use AI edits to simplify, expand, or correct labels before export.
Continue with adjacent AI tools for scientific figures, research diagrams, and academic infographics.
Turn research notes, methods, data, and science topics into labeled scientific figure drafts with AI.
Generate clear scientific illustrations, concept diagrams, and explanation visuals from text, papers, links, and topics.
Create graphical abstract drafts from papers, abstracts, methods, findings, and research notes.
Turn research findings, methods, literature notes, and data into clear academic infographics.
Turn notes, papers, lesson plans, and topics into concept maps that show ideas, links, hierarchy, and relationships.
Turn papers, lab notes, links, text, and data into scientific figures, graphical abstracts, biology diagrams, and research visuals. AI Scientific Figure Maker | Built for research and education