Generate from source material
Start with lab notes, papers, PDFs, text, links, data, or topics instead of a blank canvas.
Generate, edit, and export scientific figures from text, PDFs, papers, references, sketches, and research data.
Start with lab notes, papers, PDFs, text, links, data, or topics instead of a blank canvas.
Ask for clearer labels, simpler captions, new sections, or a different visual hierarchy after generation.
Prepare visuals for papers, posters, slides, classroom material, and academic communication.
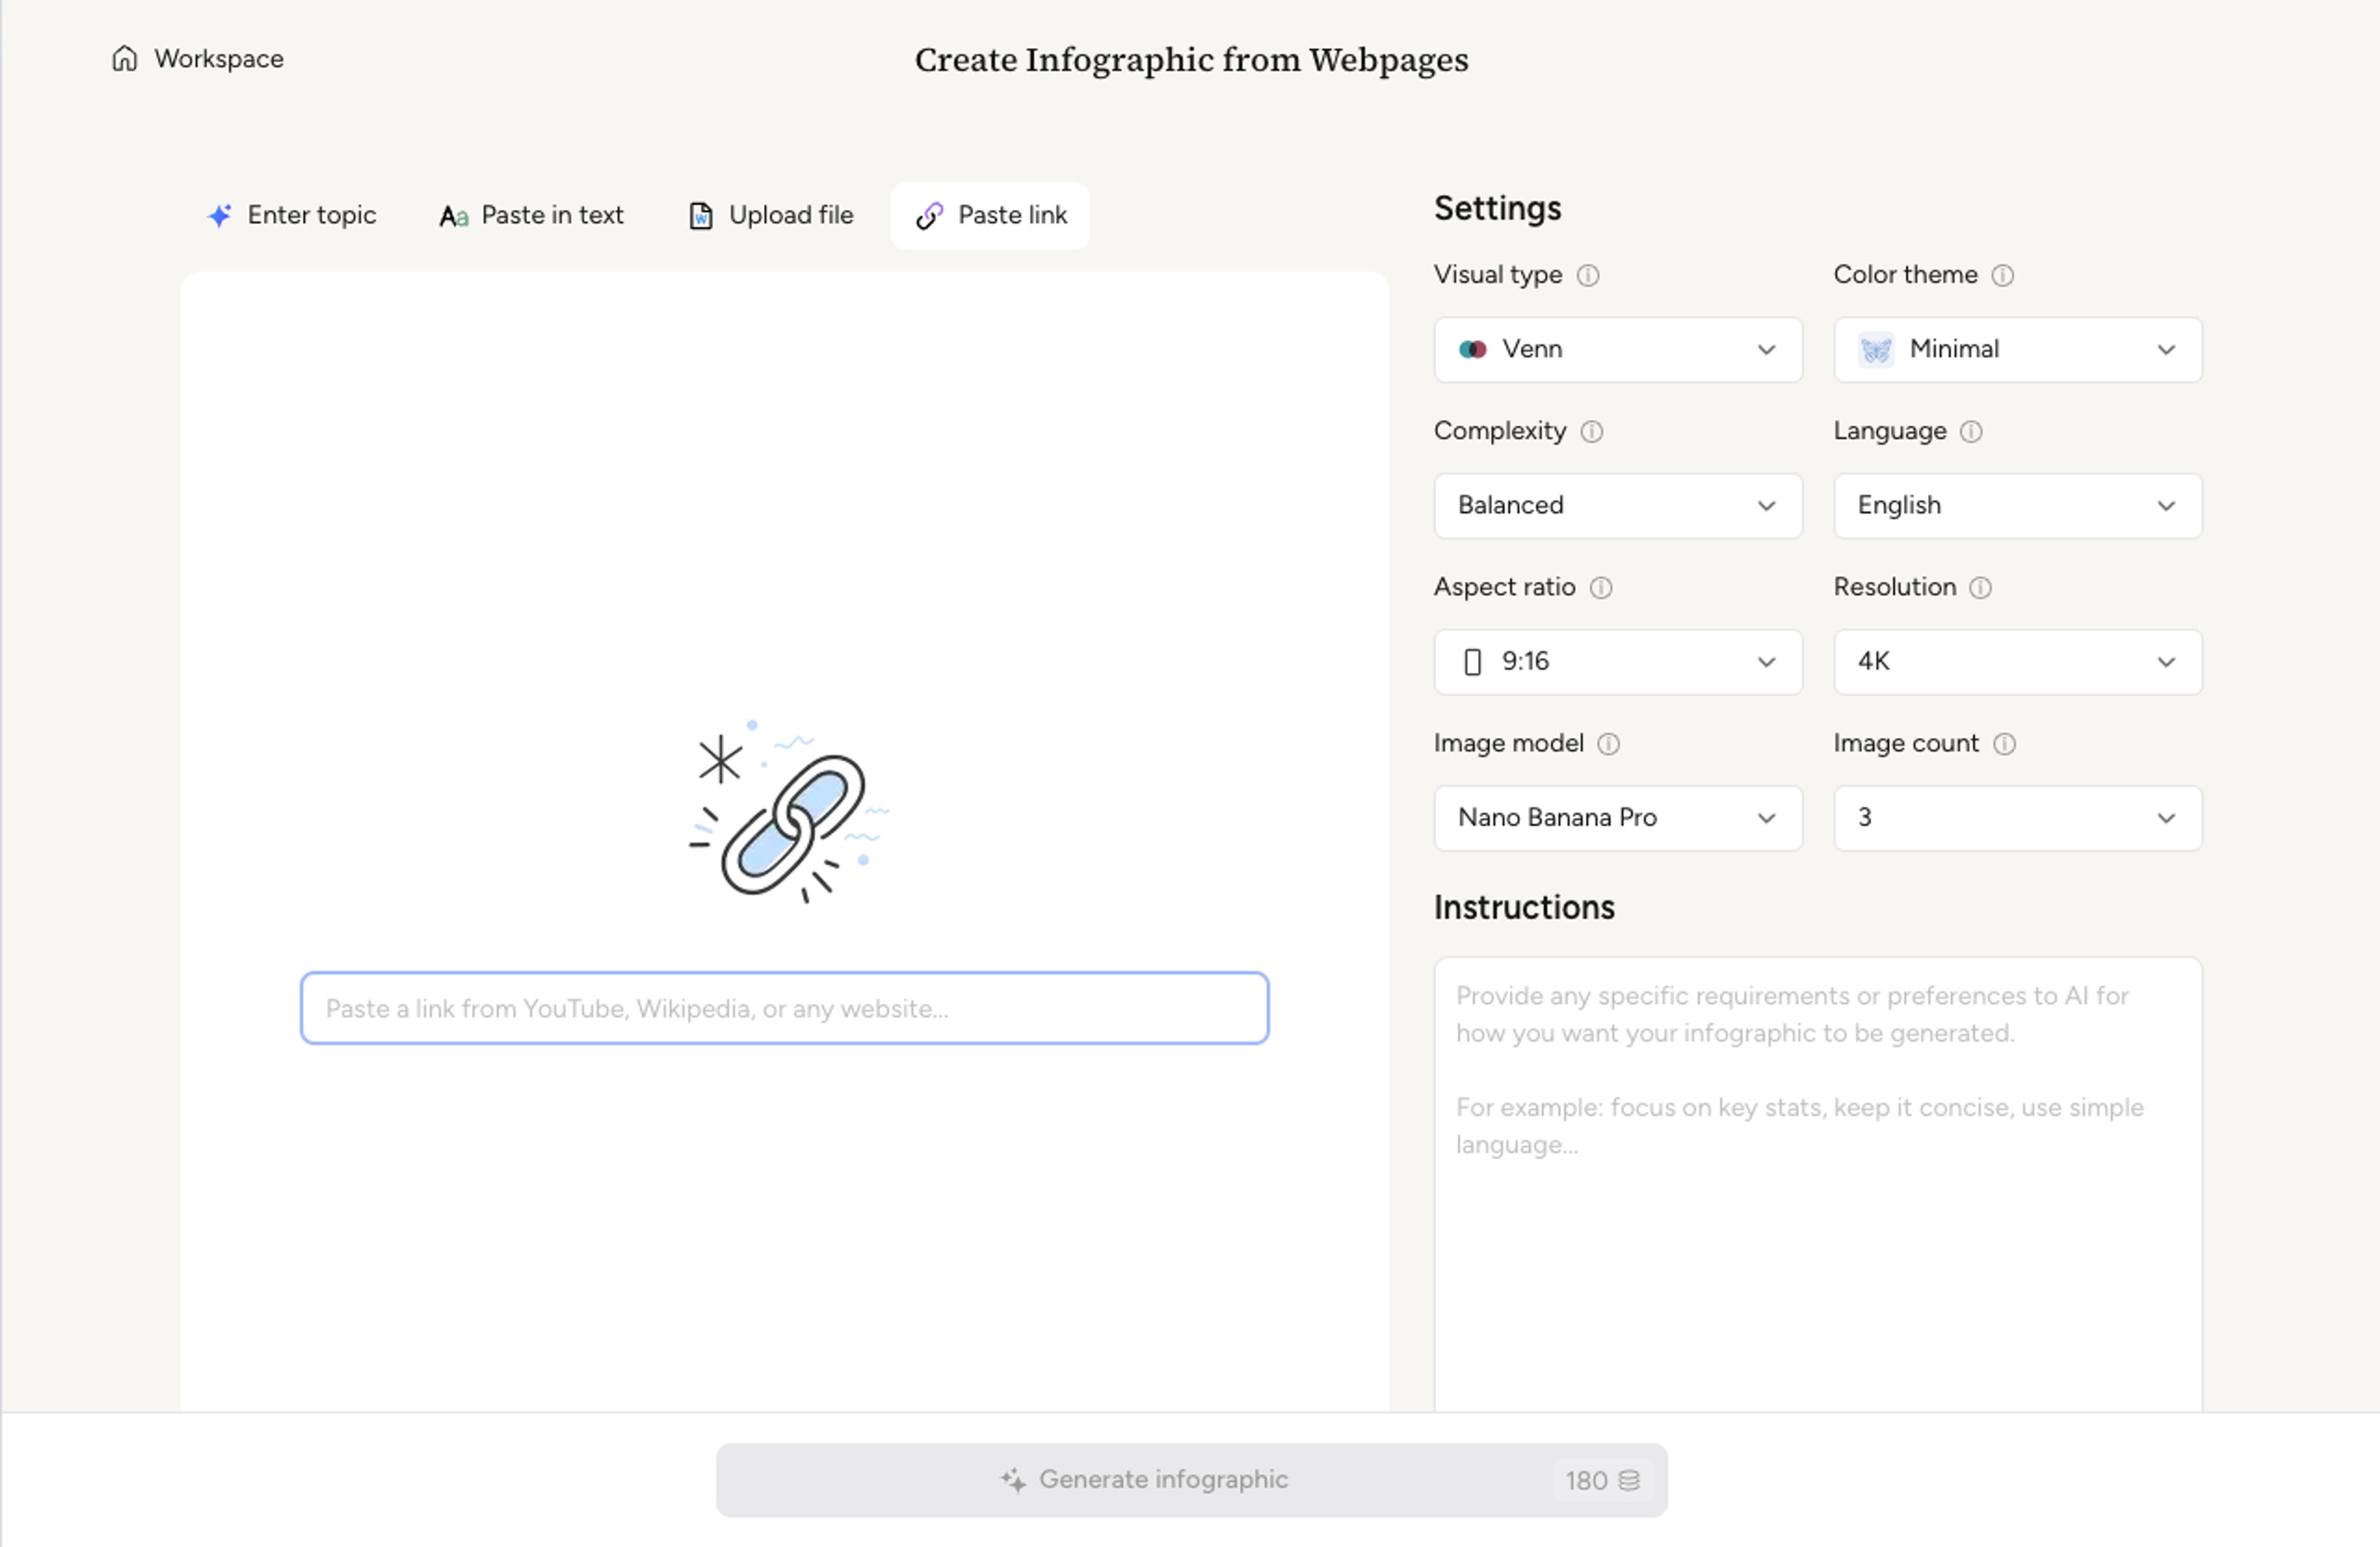
Add papers, notes, text, data, links, or a topic so Infograph.me has the scientific context.
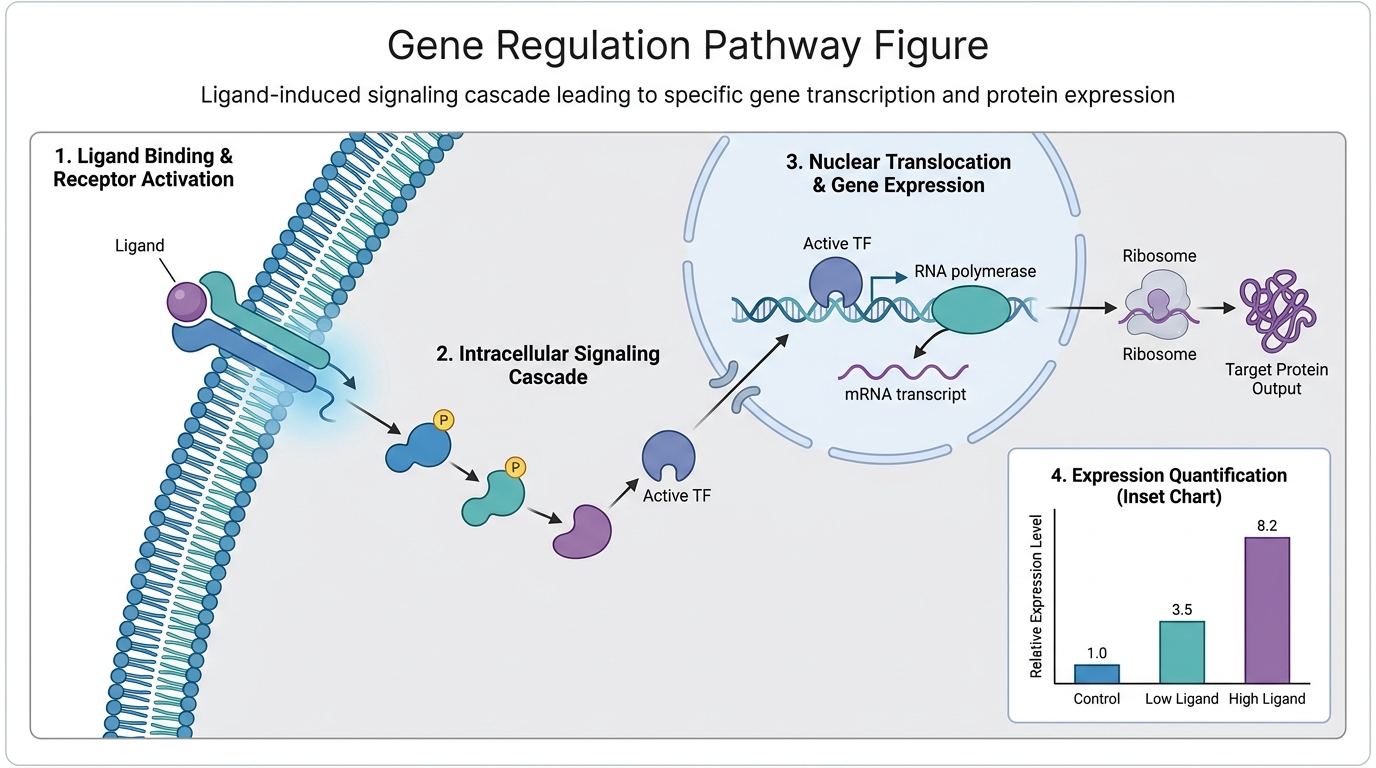
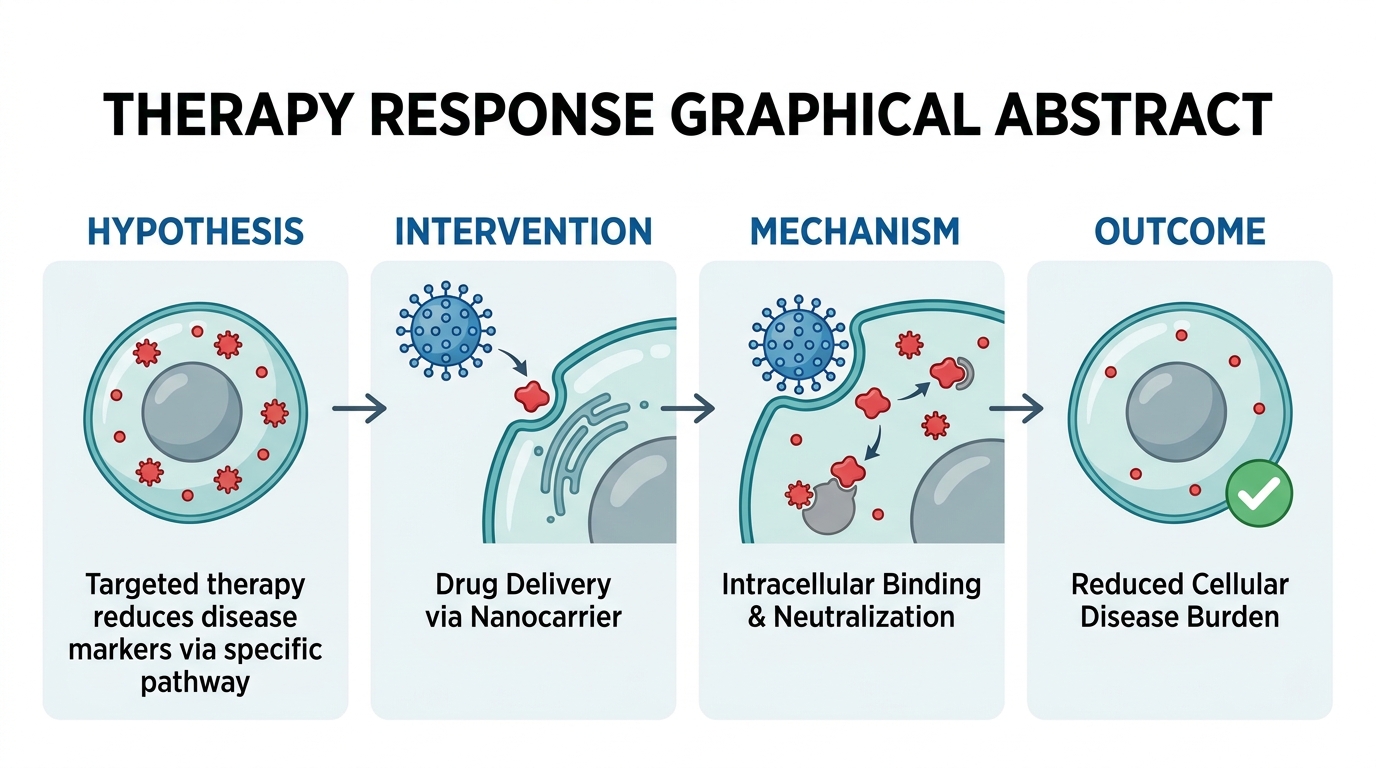
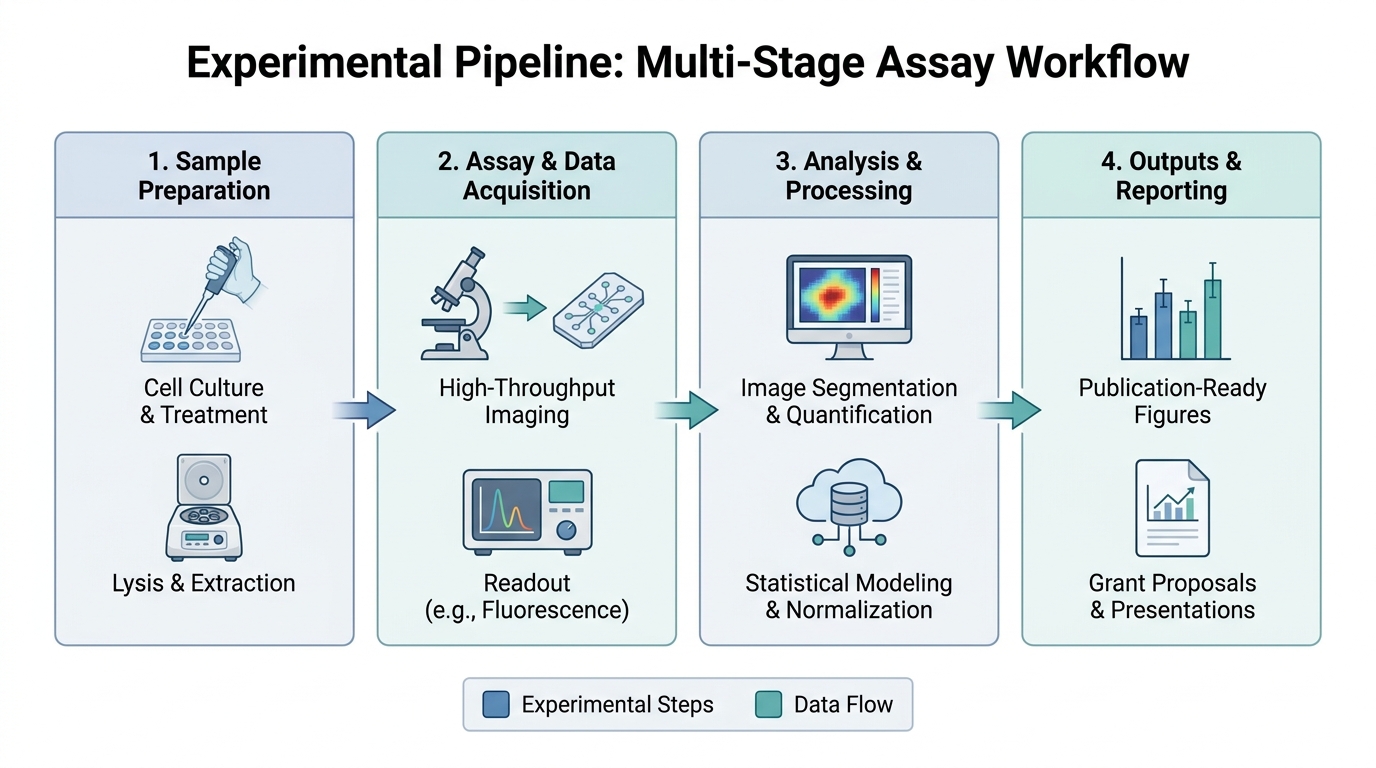
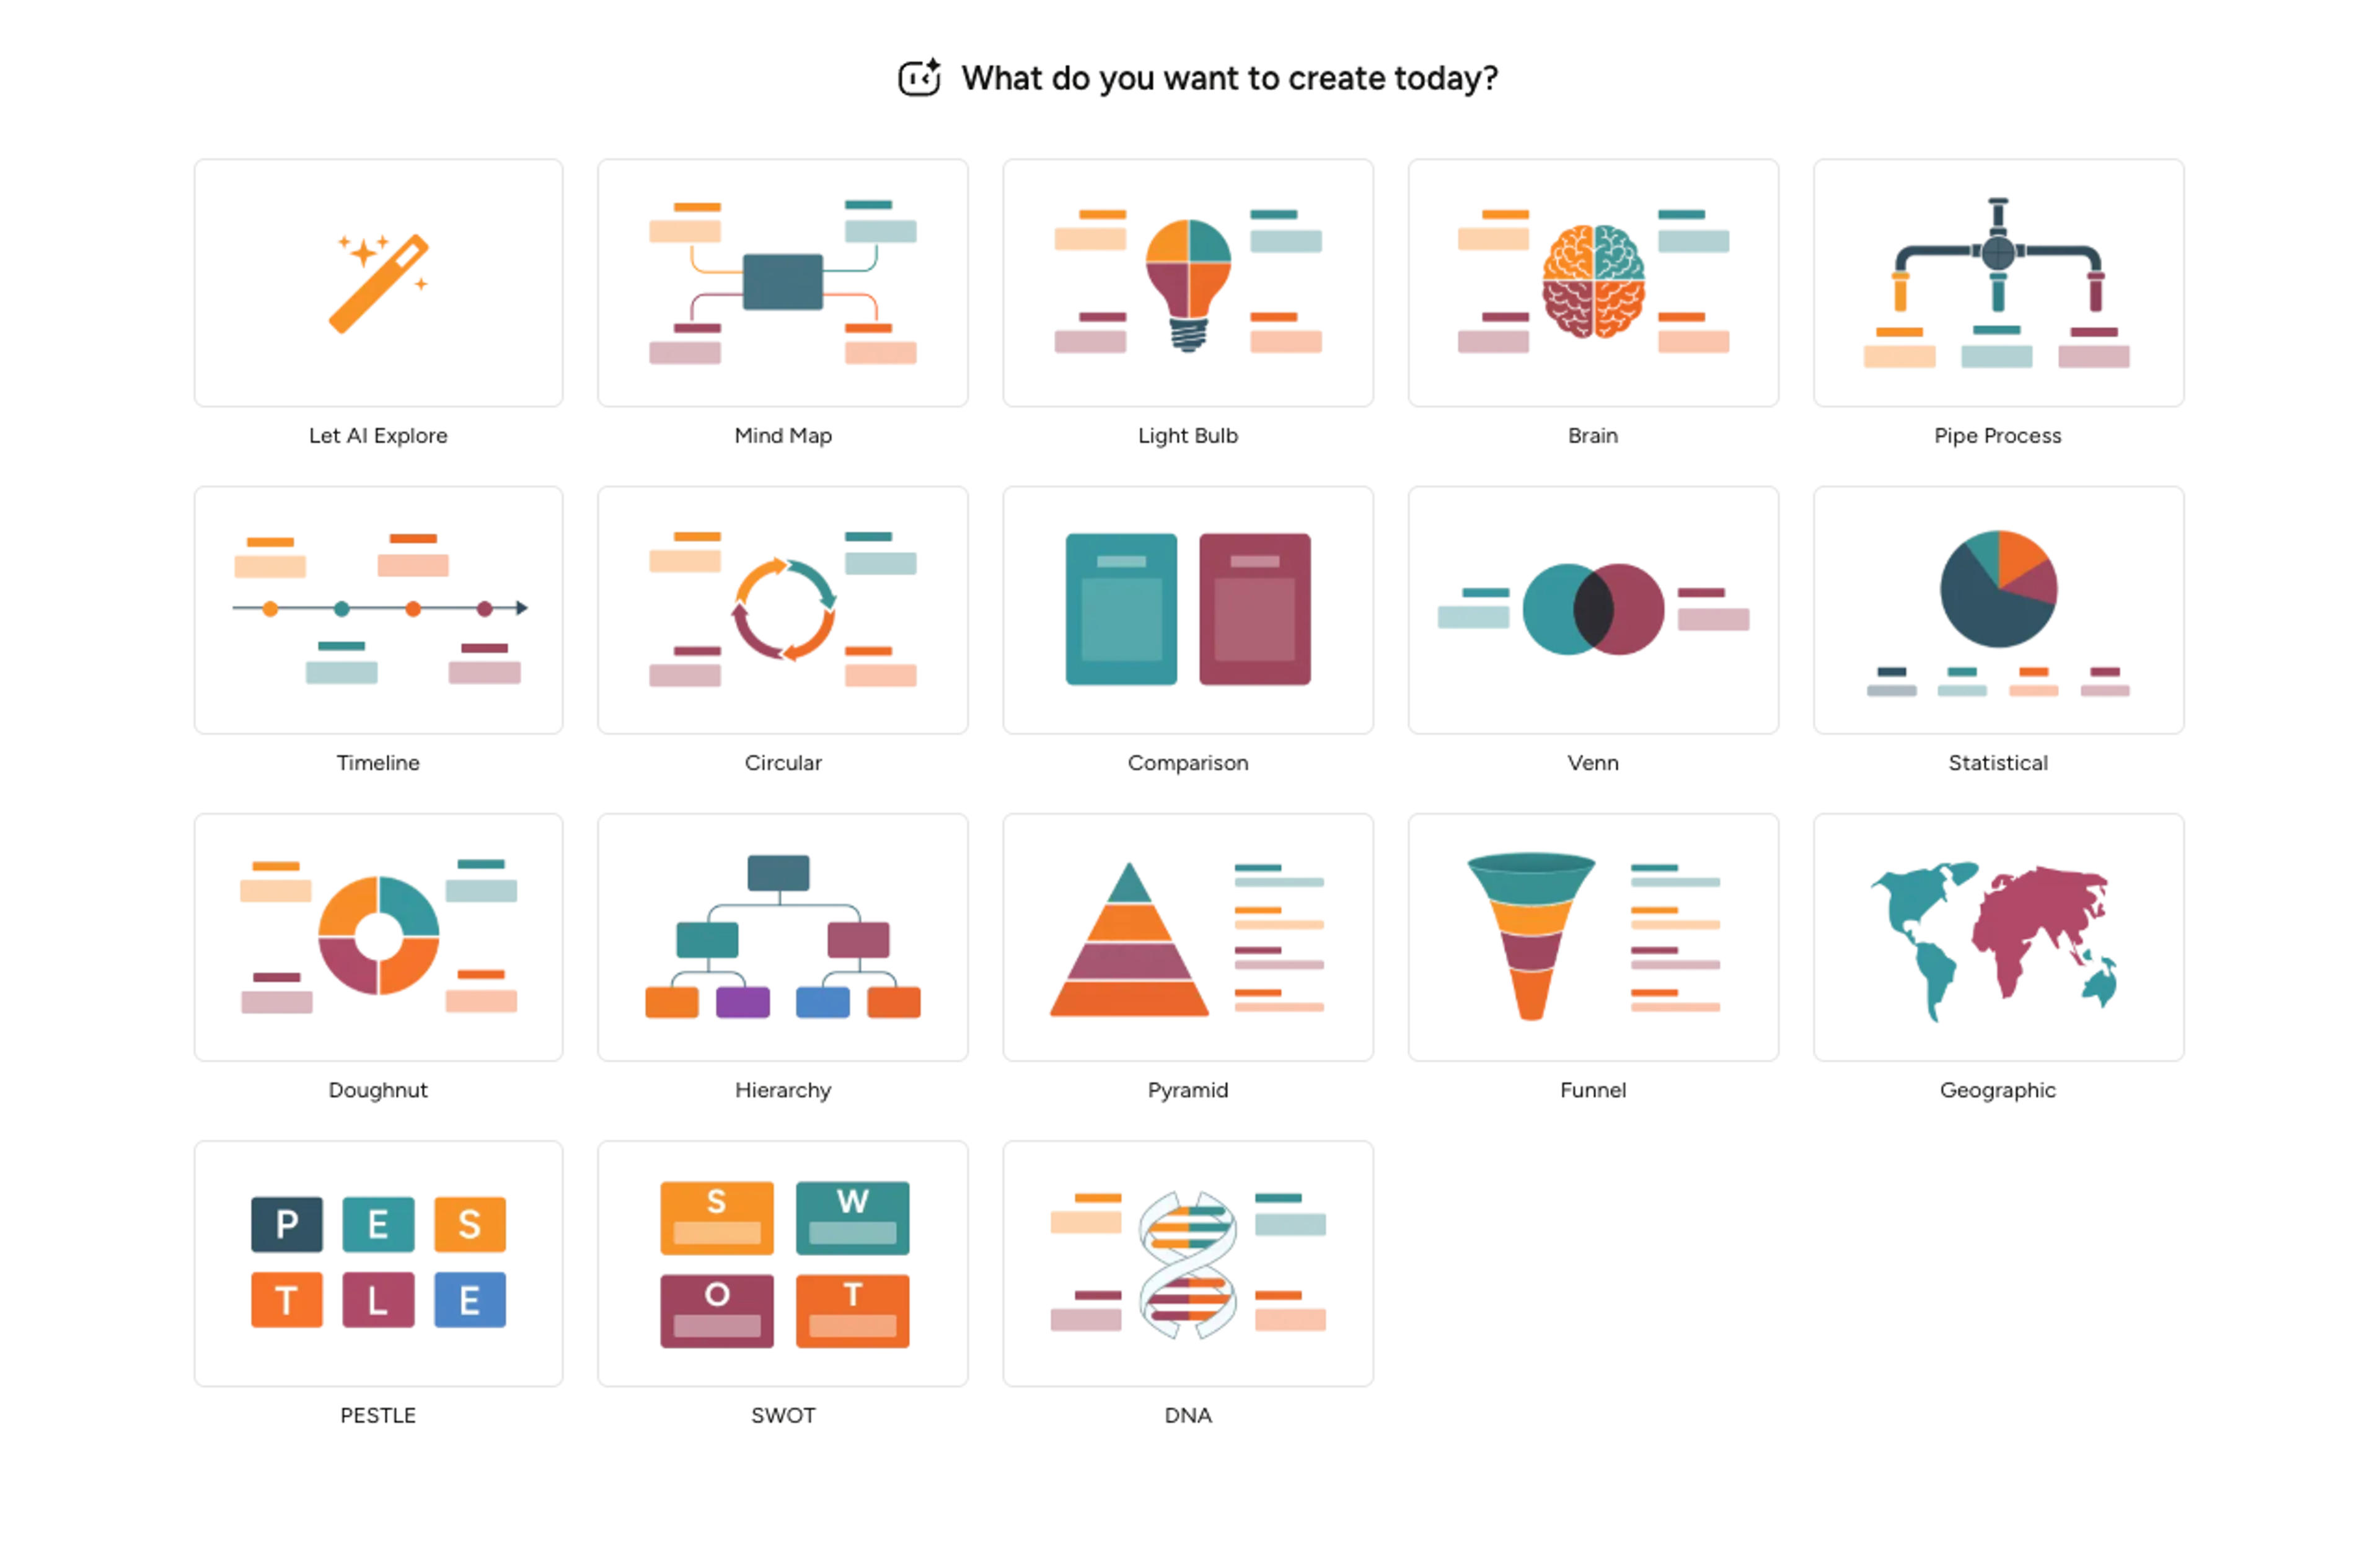
Ask for a figure, graphical abstract, method diagram, concept map, timeline, or classroom-friendly explanation.
Infograph.me structures the source into labeled panels, captions, callouts, and readable visual hierarchy.
Use AI edits to improve labels, layout, and audience fit, then export the visual for your workflow.
Infograph.me focuses on readable scientific figures, research diagrams, classroom visuals, and academic communication.
Pages and examples are framed around scientific figures, graphical abstracts, and research diagrams.
Support text, documents, PDFs, papers, references, links, data, and topics.
Keep dense scientific information structured with labels, captions, and callouts.
Use flowcharts, timelines, concept maps, Venn diagrams, and figure panels when they fit.
Create visuals that can be reused in slides, posters, reports, and teaching material.
Change emphasis, wording, layout direction, or audience level without rebuilding from scratch.
They are AI workflows for turning source material into scientific figures, graphical abstracts, diagrams, and research visuals.
Yes. Use PDF-to-figure or paper-to-figure workflows to turn research material into a structured visual draft.
Yes. Use AI editing instructions to rewrite labels, simplify sections, change emphasis, or reorganize the figure.
No. Researchers, university students, professors, K-12 teachers, and science communicators can use these workflows.
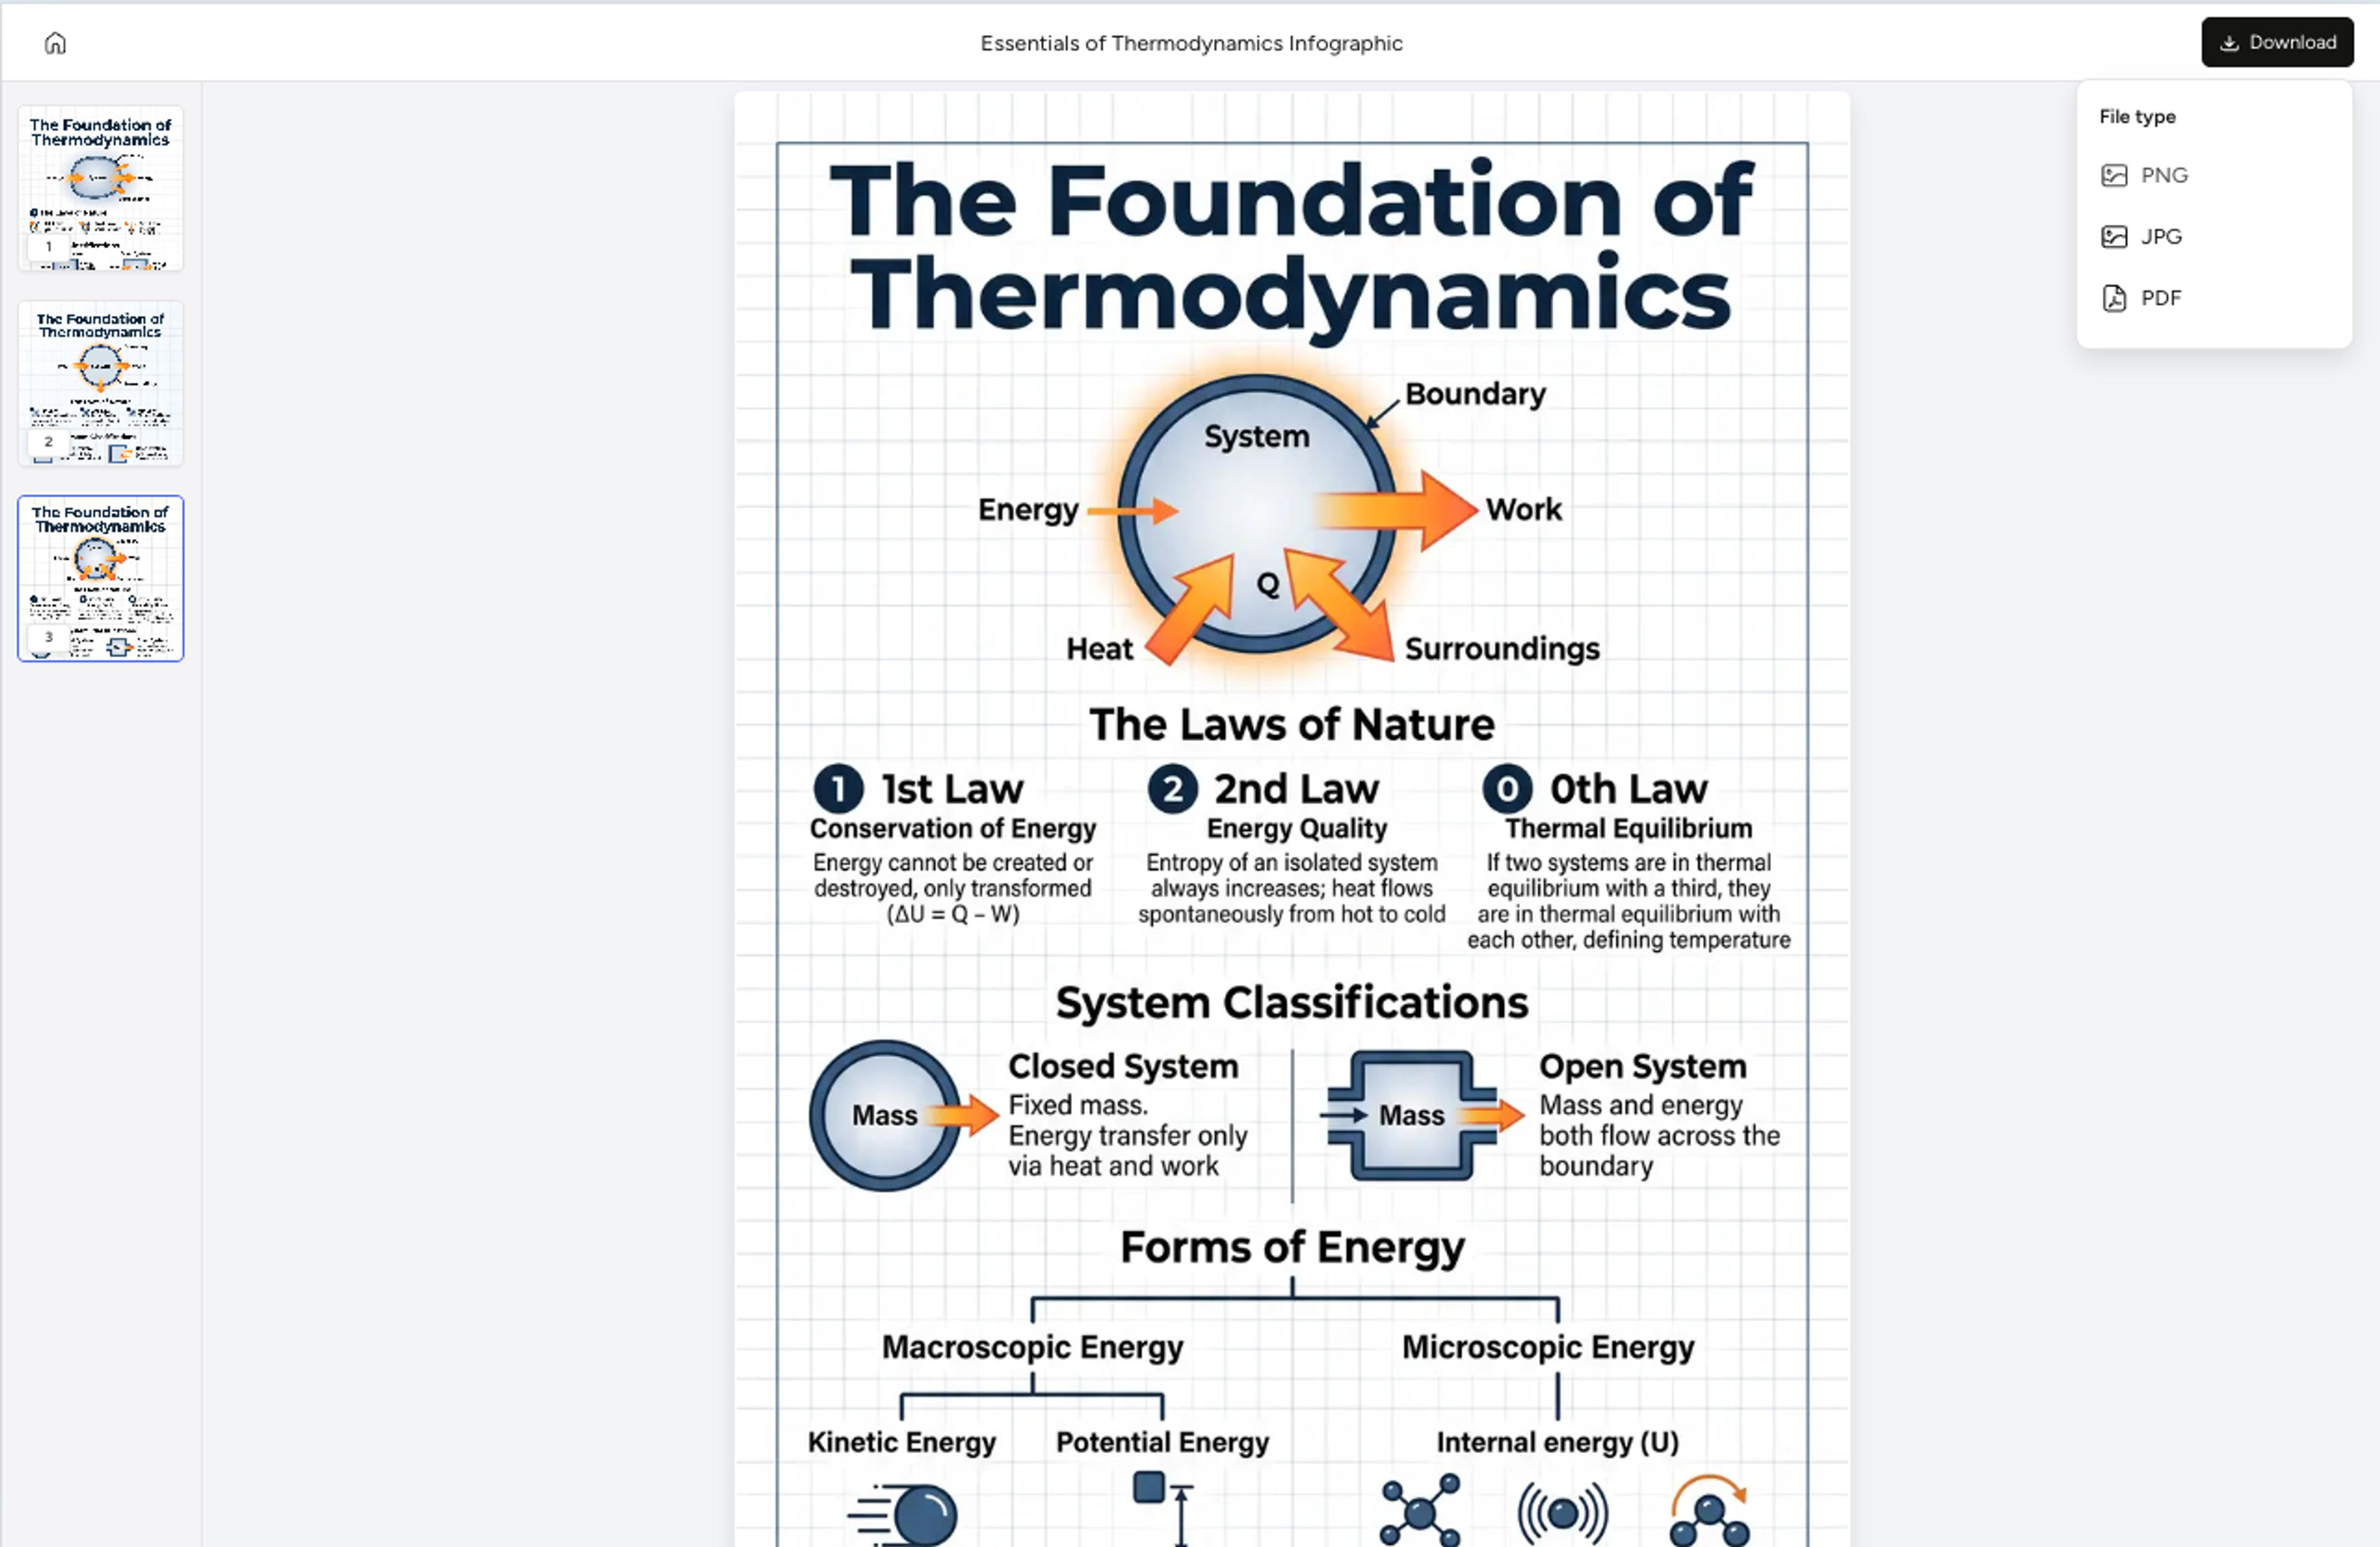
Current marketing pages emphasize PNG, JPG, PDF, and editable slide workflows where supported by the product.
Continue with adjacent Infograph.me pages for scientific figures, source-to-visual workflows, editing, and export.
Turn research notes, methods, data, and science topics into labeled scientific figure drafts with AI.
Generate clear scientific illustrations, concept diagrams, and explanation visuals from text, papers, links, and topics.
Create graphical abstract drafts from papers, abstracts, methods, findings, and research notes.
Turn research findings, methods, literature notes, and data into clear academic infographics.
Paste methods, abstracts, lesson text, or research notes and turn them into labeled scientific figure drafts.
Upload a paper, report, or lesson PDF and turn the source into a scientific figure, diagram, or graphical abstract draft.
Refine generated scientific figures with AI instructions for labels, layout, captions, hierarchy, and visual emphasis.
Prepare scientific figures for lectures, lab meetings, posters, and research presentations with editable slide workflows.