

Upload research PDFs
Start from papers, reports, protocols, class handouts, or review material.
Upload a paper, report, or lesson PDF and turn the source into a scientific figure, diagram, or graphical abstract draft.
Drag and drop your paper, lab notes, lesson material, or document here or
Use the same source-to-visual workflow for biology, graphical abstracts, research workflows, and classroom science.
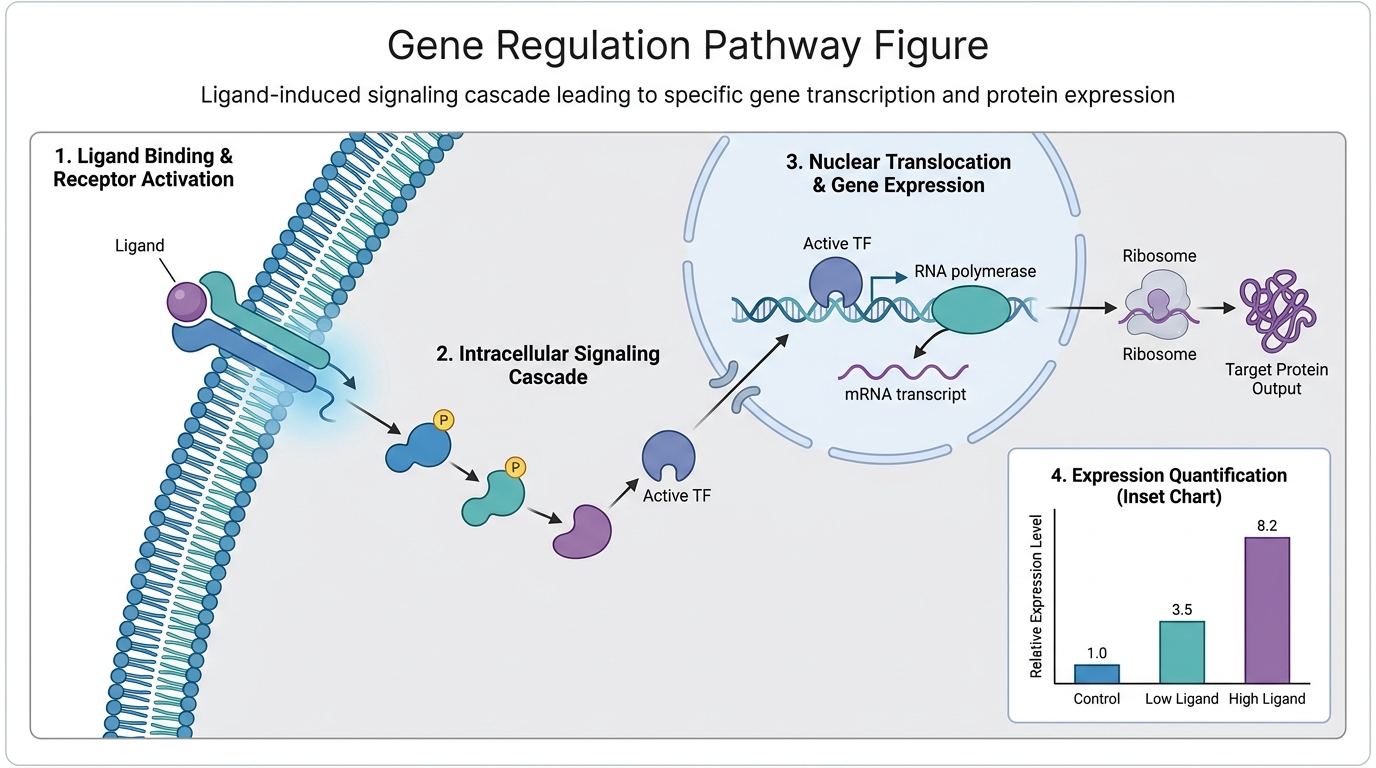
Turn a mechanism description into a labeled figure with pathway, transcription, and outcome panels.
Start from real research or teaching material and create visuals that are easier to explain, review, and share.
Start from papers, reports, protocols, class handouts, or review material.
Turn sections, methods, evidence, and results into a figure draft with hierarchy.
Generate an academic version for papers or a simpler version for teaching.
Add papers, notes, text, data, links, or a topic so Infograph.me has the scientific context.
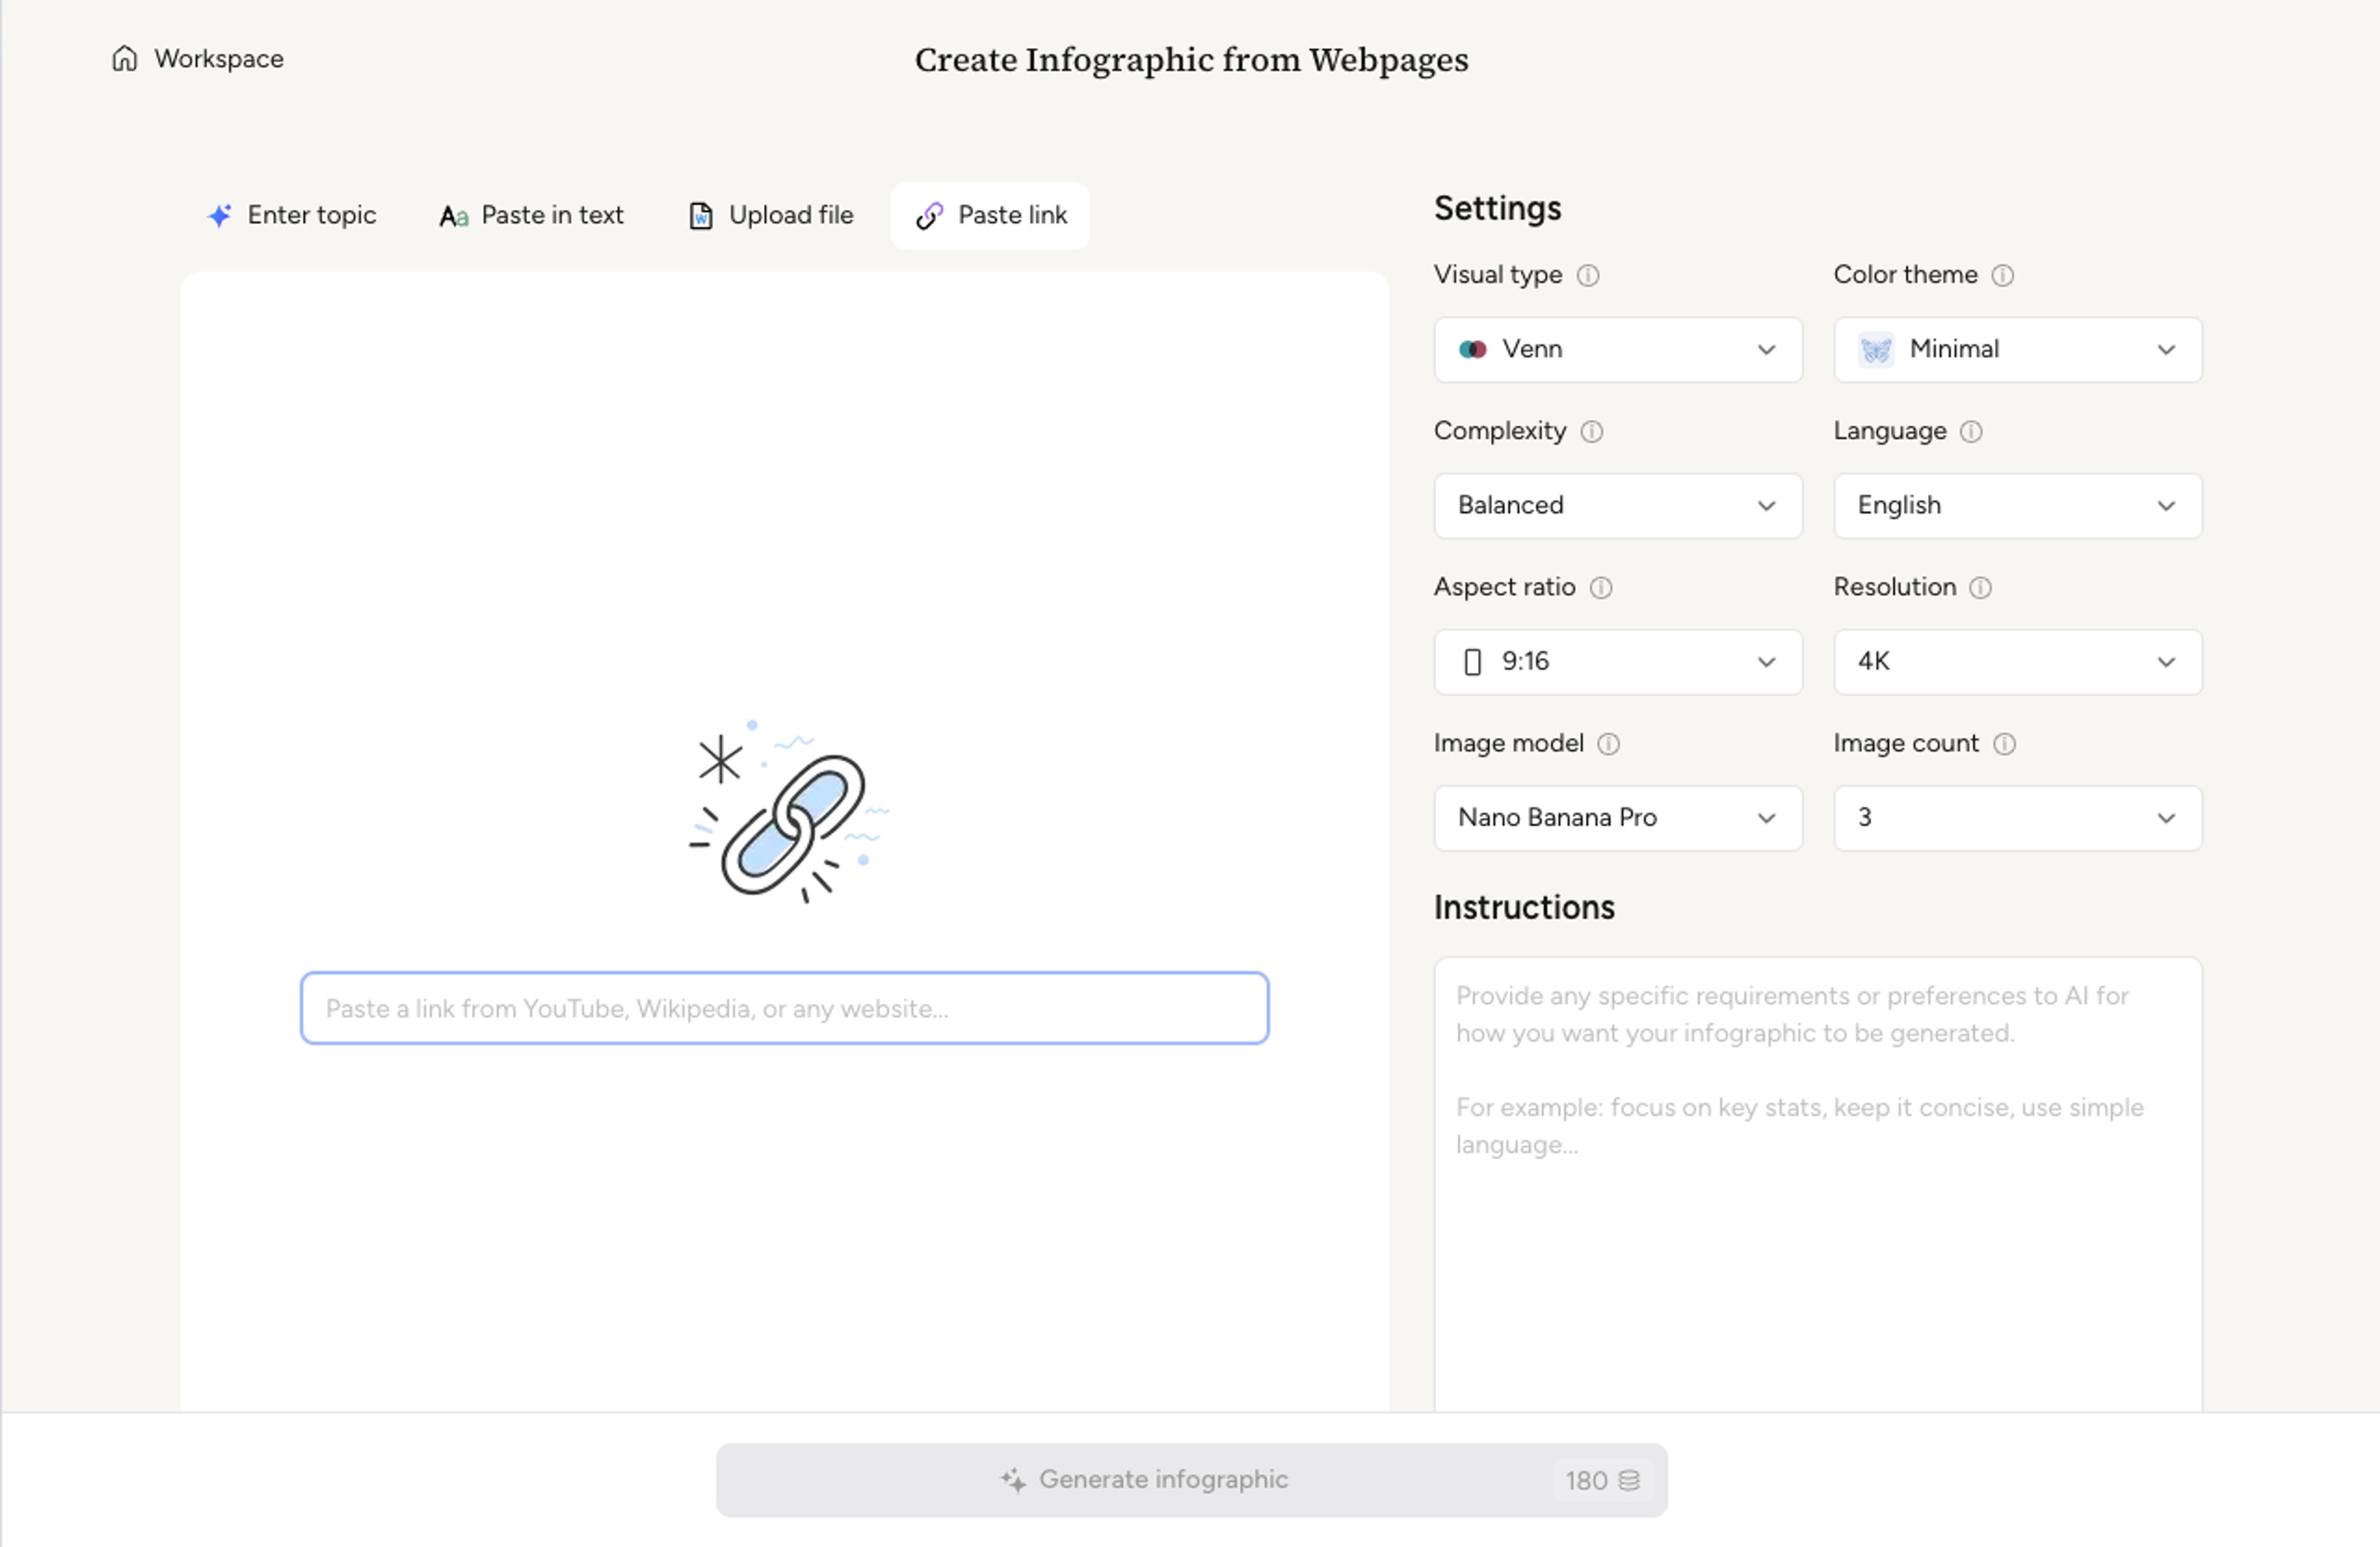
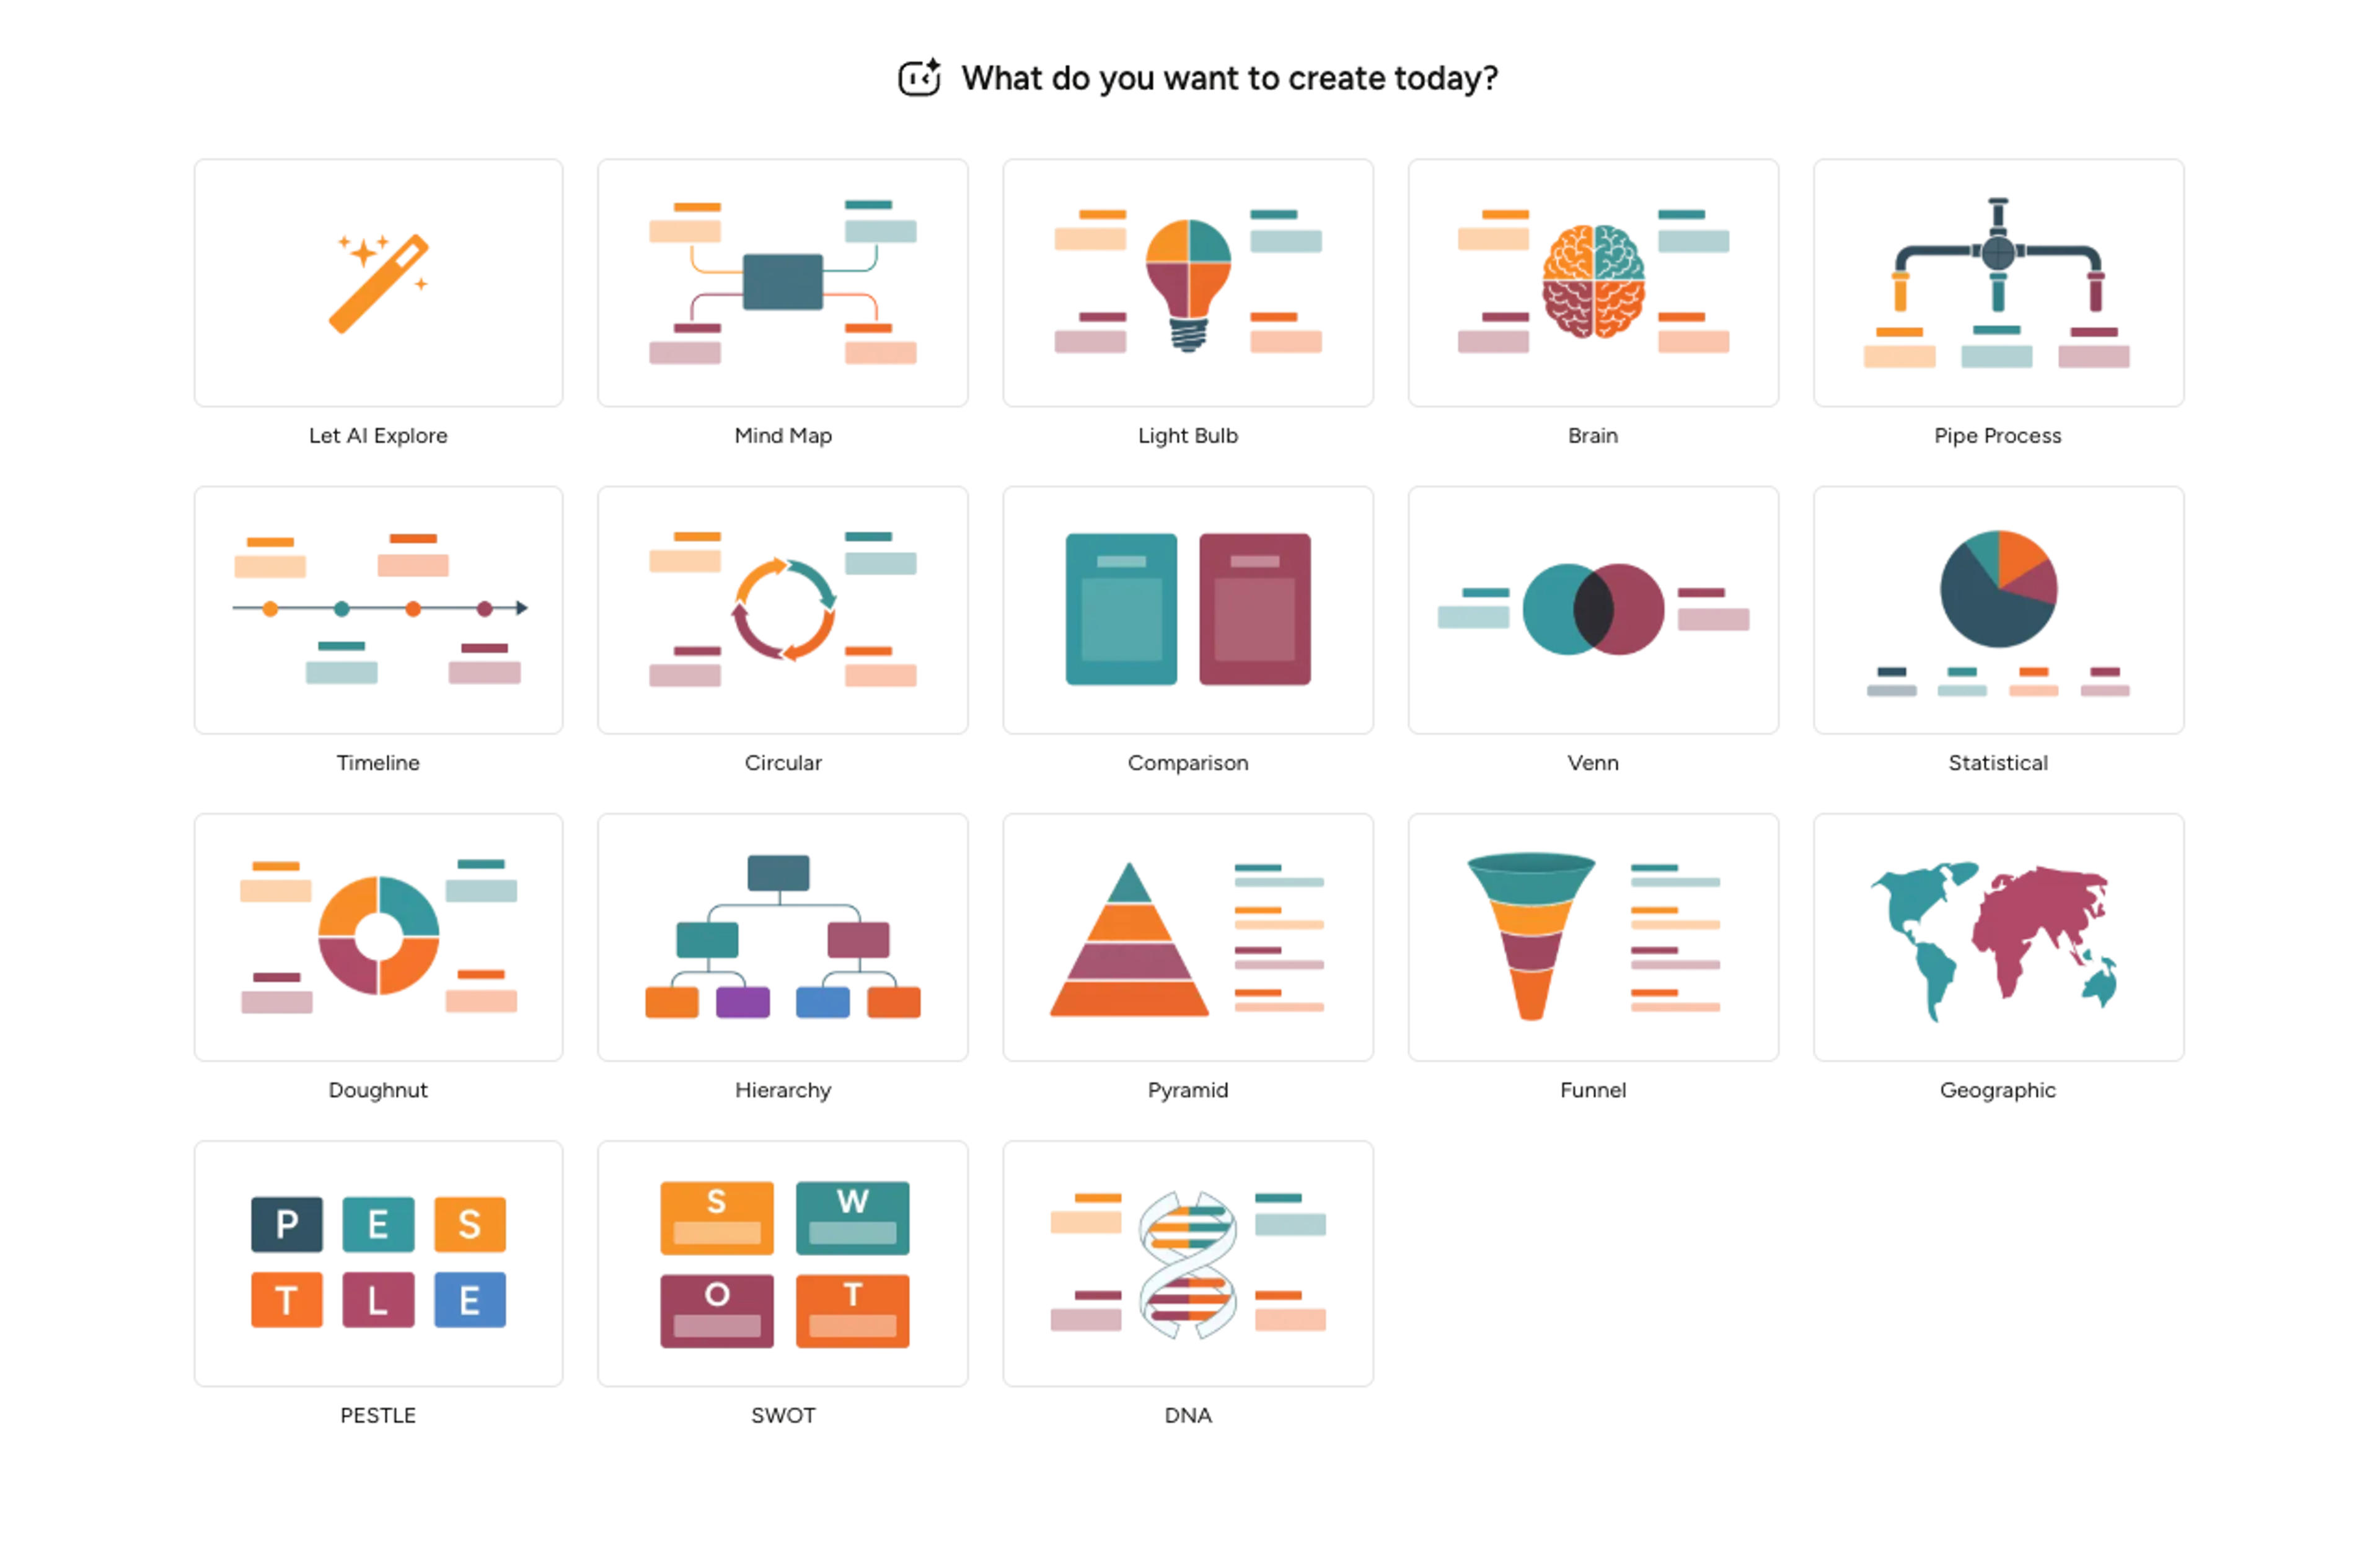
Ask for a figure, graphical abstract, method diagram, concept map, timeline, or classroom-friendly explanation.
Infograph.me structures the source into labeled panels, captions, callouts, and readable visual hierarchy.
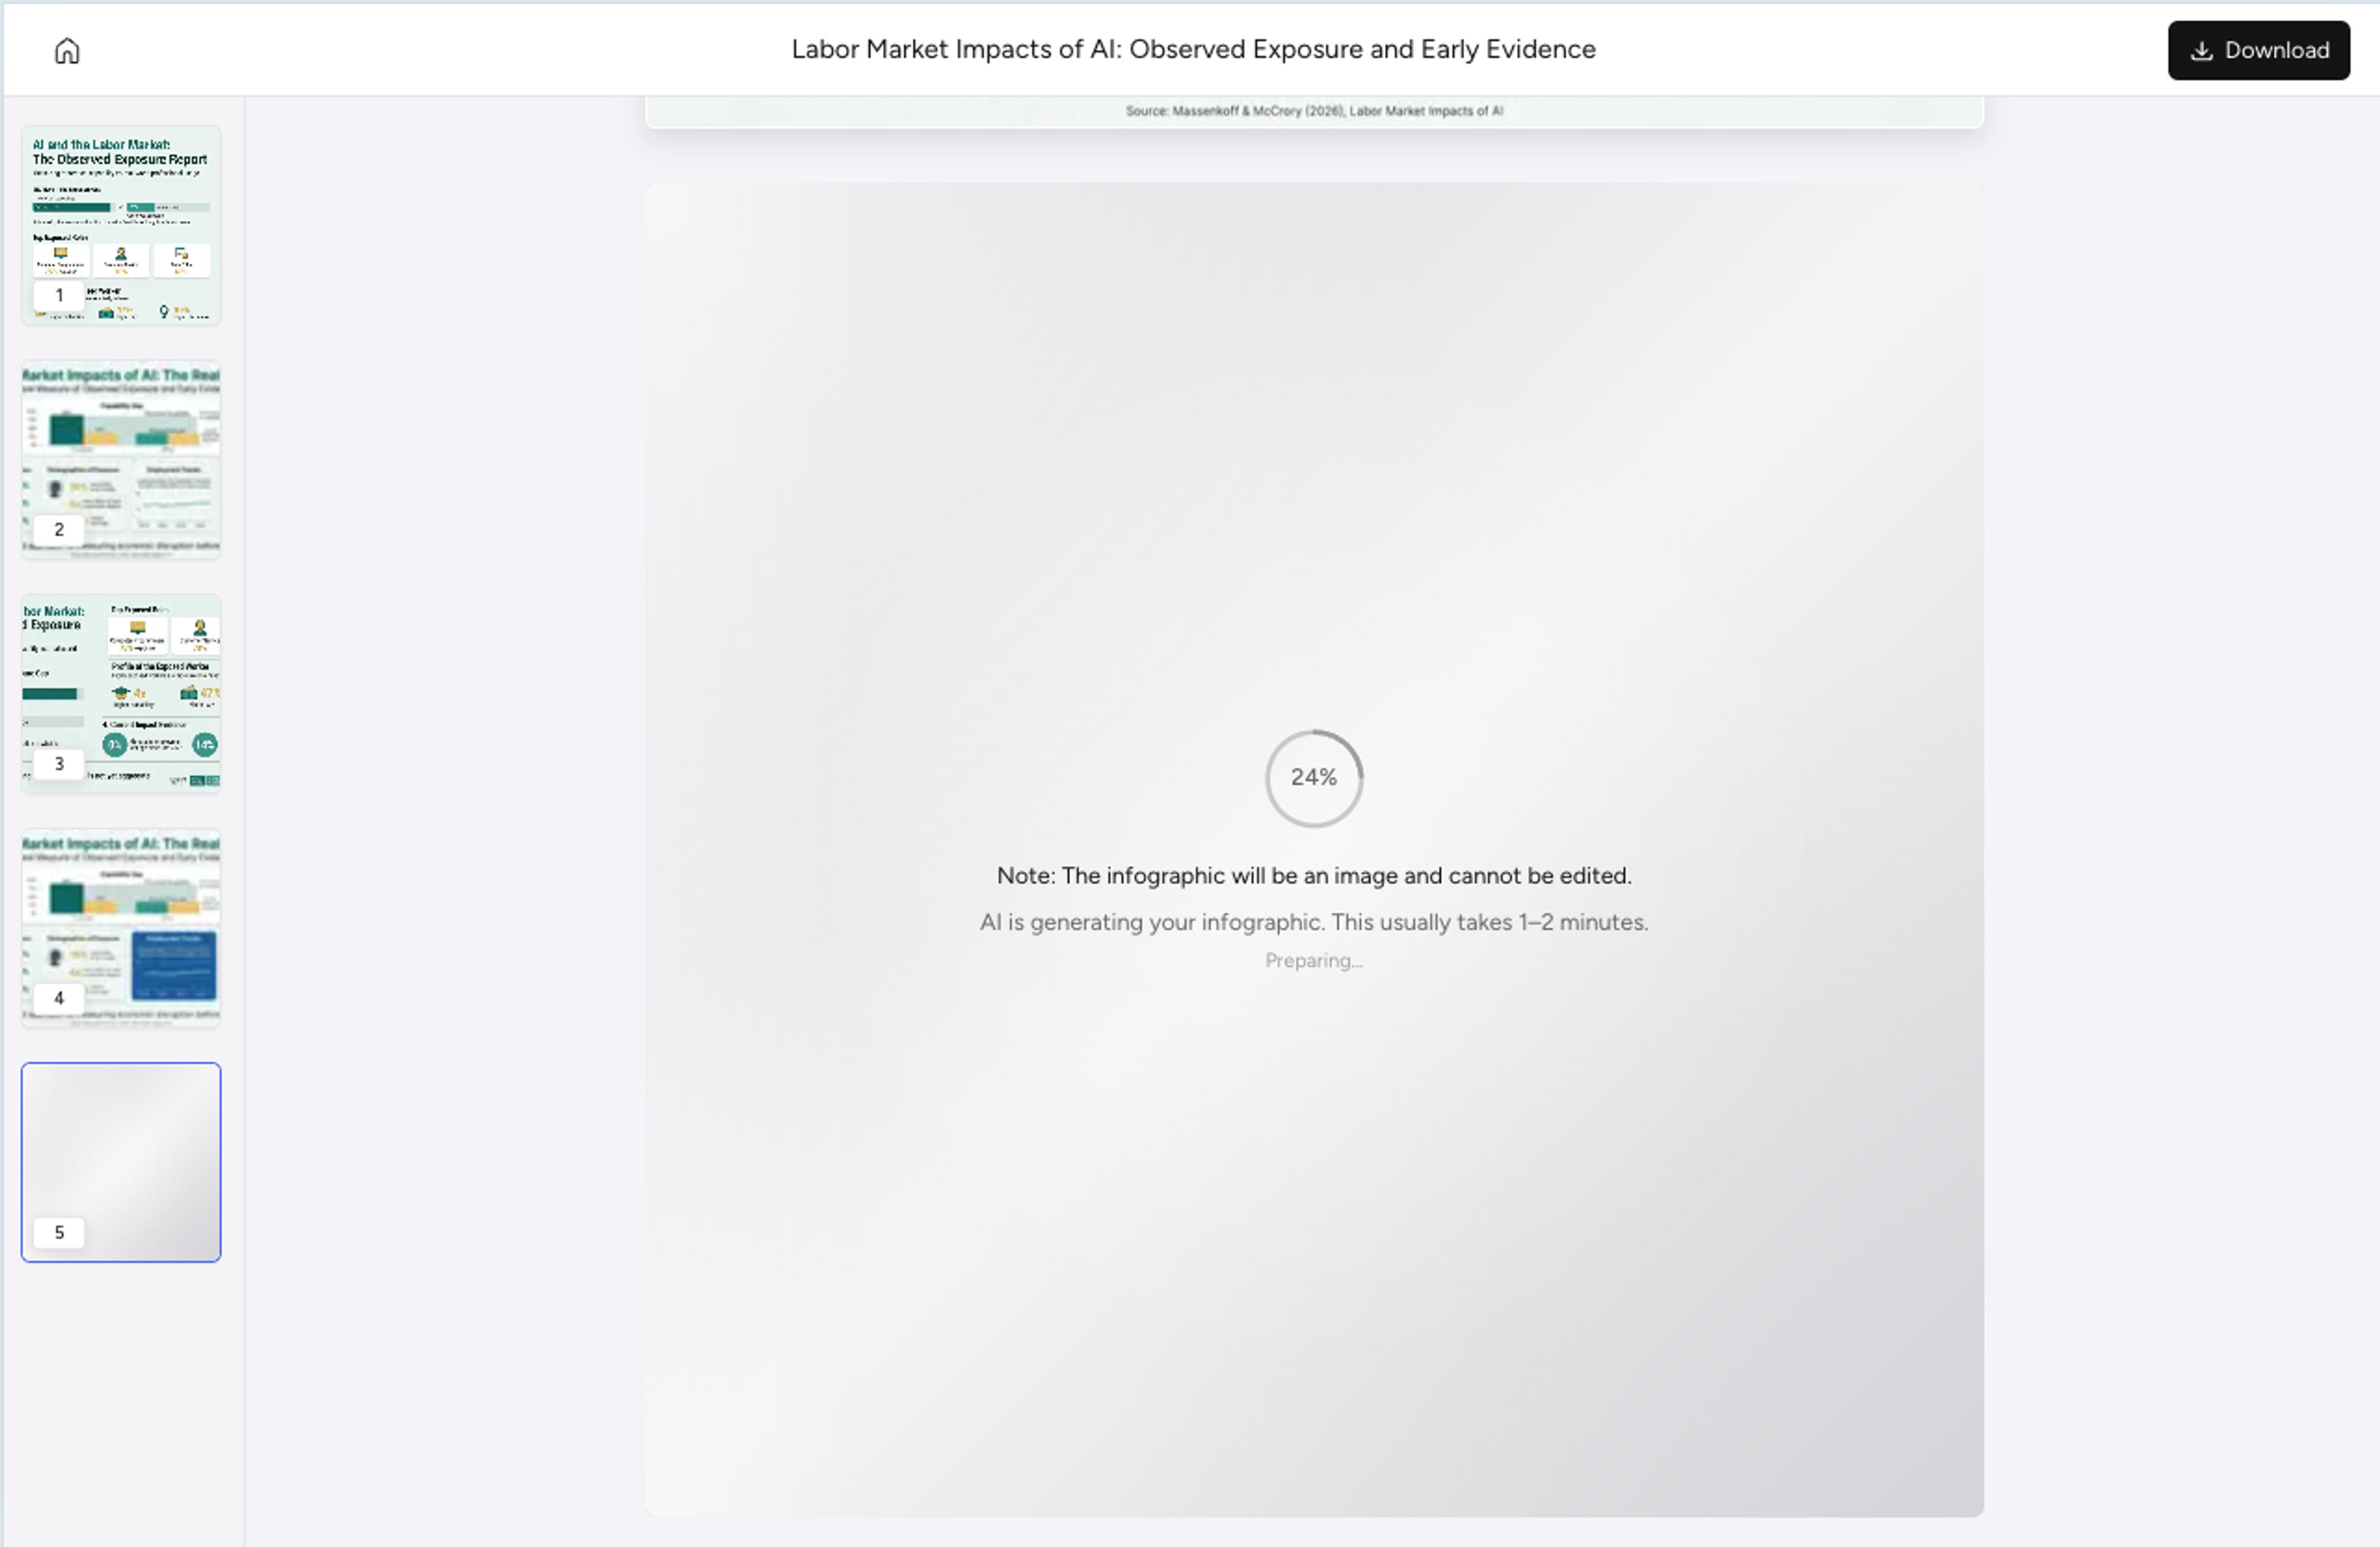
Use AI edits to improve labels, layout, and audience fit, then export the visual for your workflow.
Infograph.me focuses on readable scientific figures, research diagrams, classroom visuals, and academic communication.
Use the PDF as the source so the figure stays close to the document.
Summarize workflows, experimental designs, and protocol steps.
Convert findings and tables into visual explanation drafts.
Turn study narrative into a compact visual summary.
Ask for clearer labels, shorter captions, or alternate layouts.
Use outputs in slides, posters, handouts, and report workflows.
Yes. Upload a PDF and Infograph.me can use it as source material for figure and diagram drafts.
It can help turn the important sections into a visual summary, but you should review the output for scientific accuracy.
Yes. Teachers can turn lesson PDFs into concept diagrams, timelines, or summary figures.
Yes. You can ask for a graphical abstract, methods diagram, timeline, concept map, or other visual direction.
Yes. Use AI instructions to change labels, sections, and visual emphasis.
Continue with adjacent Infograph.me pages for scientific figures, source-to-visual workflows, editing, and export.
Turn research notes, methods, data, and science topics into labeled scientific figure drafts with AI.
Generate clear scientific illustrations, concept diagrams, and explanation visuals from text, papers, links, and topics.
Create graphical abstract drafts from papers, abstracts, methods, findings, and research notes.
Turn research findings, methods, literature notes, and data into clear academic infographics.
Paste methods, abstracts, lesson text, or research notes and turn them into labeled scientific figure drafts.
Refine generated scientific figures with AI instructions for labels, layout, captions, hierarchy, and visual emphasis.
Prepare scientific figures for lectures, lab meetings, posters, and research presentations with editable slide workflows.
Turn papers, lab notes, links, text, and data into scientific figures, graphical abstracts, biology diagrams, and research visuals. AI Scientific Figure Maker | Built for research and education