Scalable diagrams
Use vector-style output for diagrams that need to stay sharp across sizes.
Use vector-friendly scientific visuals when your workflow needs scalable diagrams, clean lines, and downstream editing.
Use vector-style output for diagrams that need to stay sharp across sizes.
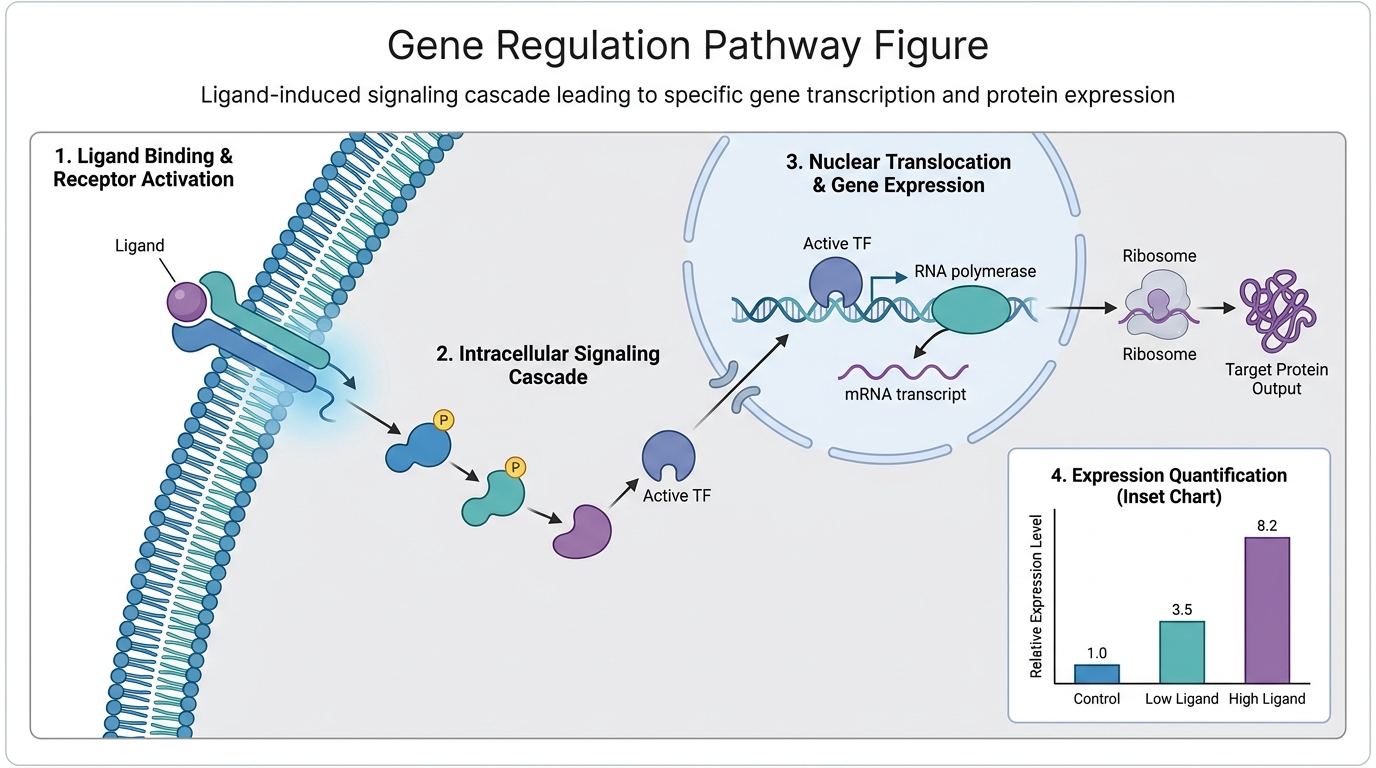
Prepare pathway, process, and concept visuals with clear shapes and labels.
Use SVG-oriented workflows when figures need additional polish in vector tools.
Add papers, notes, text, data, links, or a topic so Infograph.me has the scientific context.
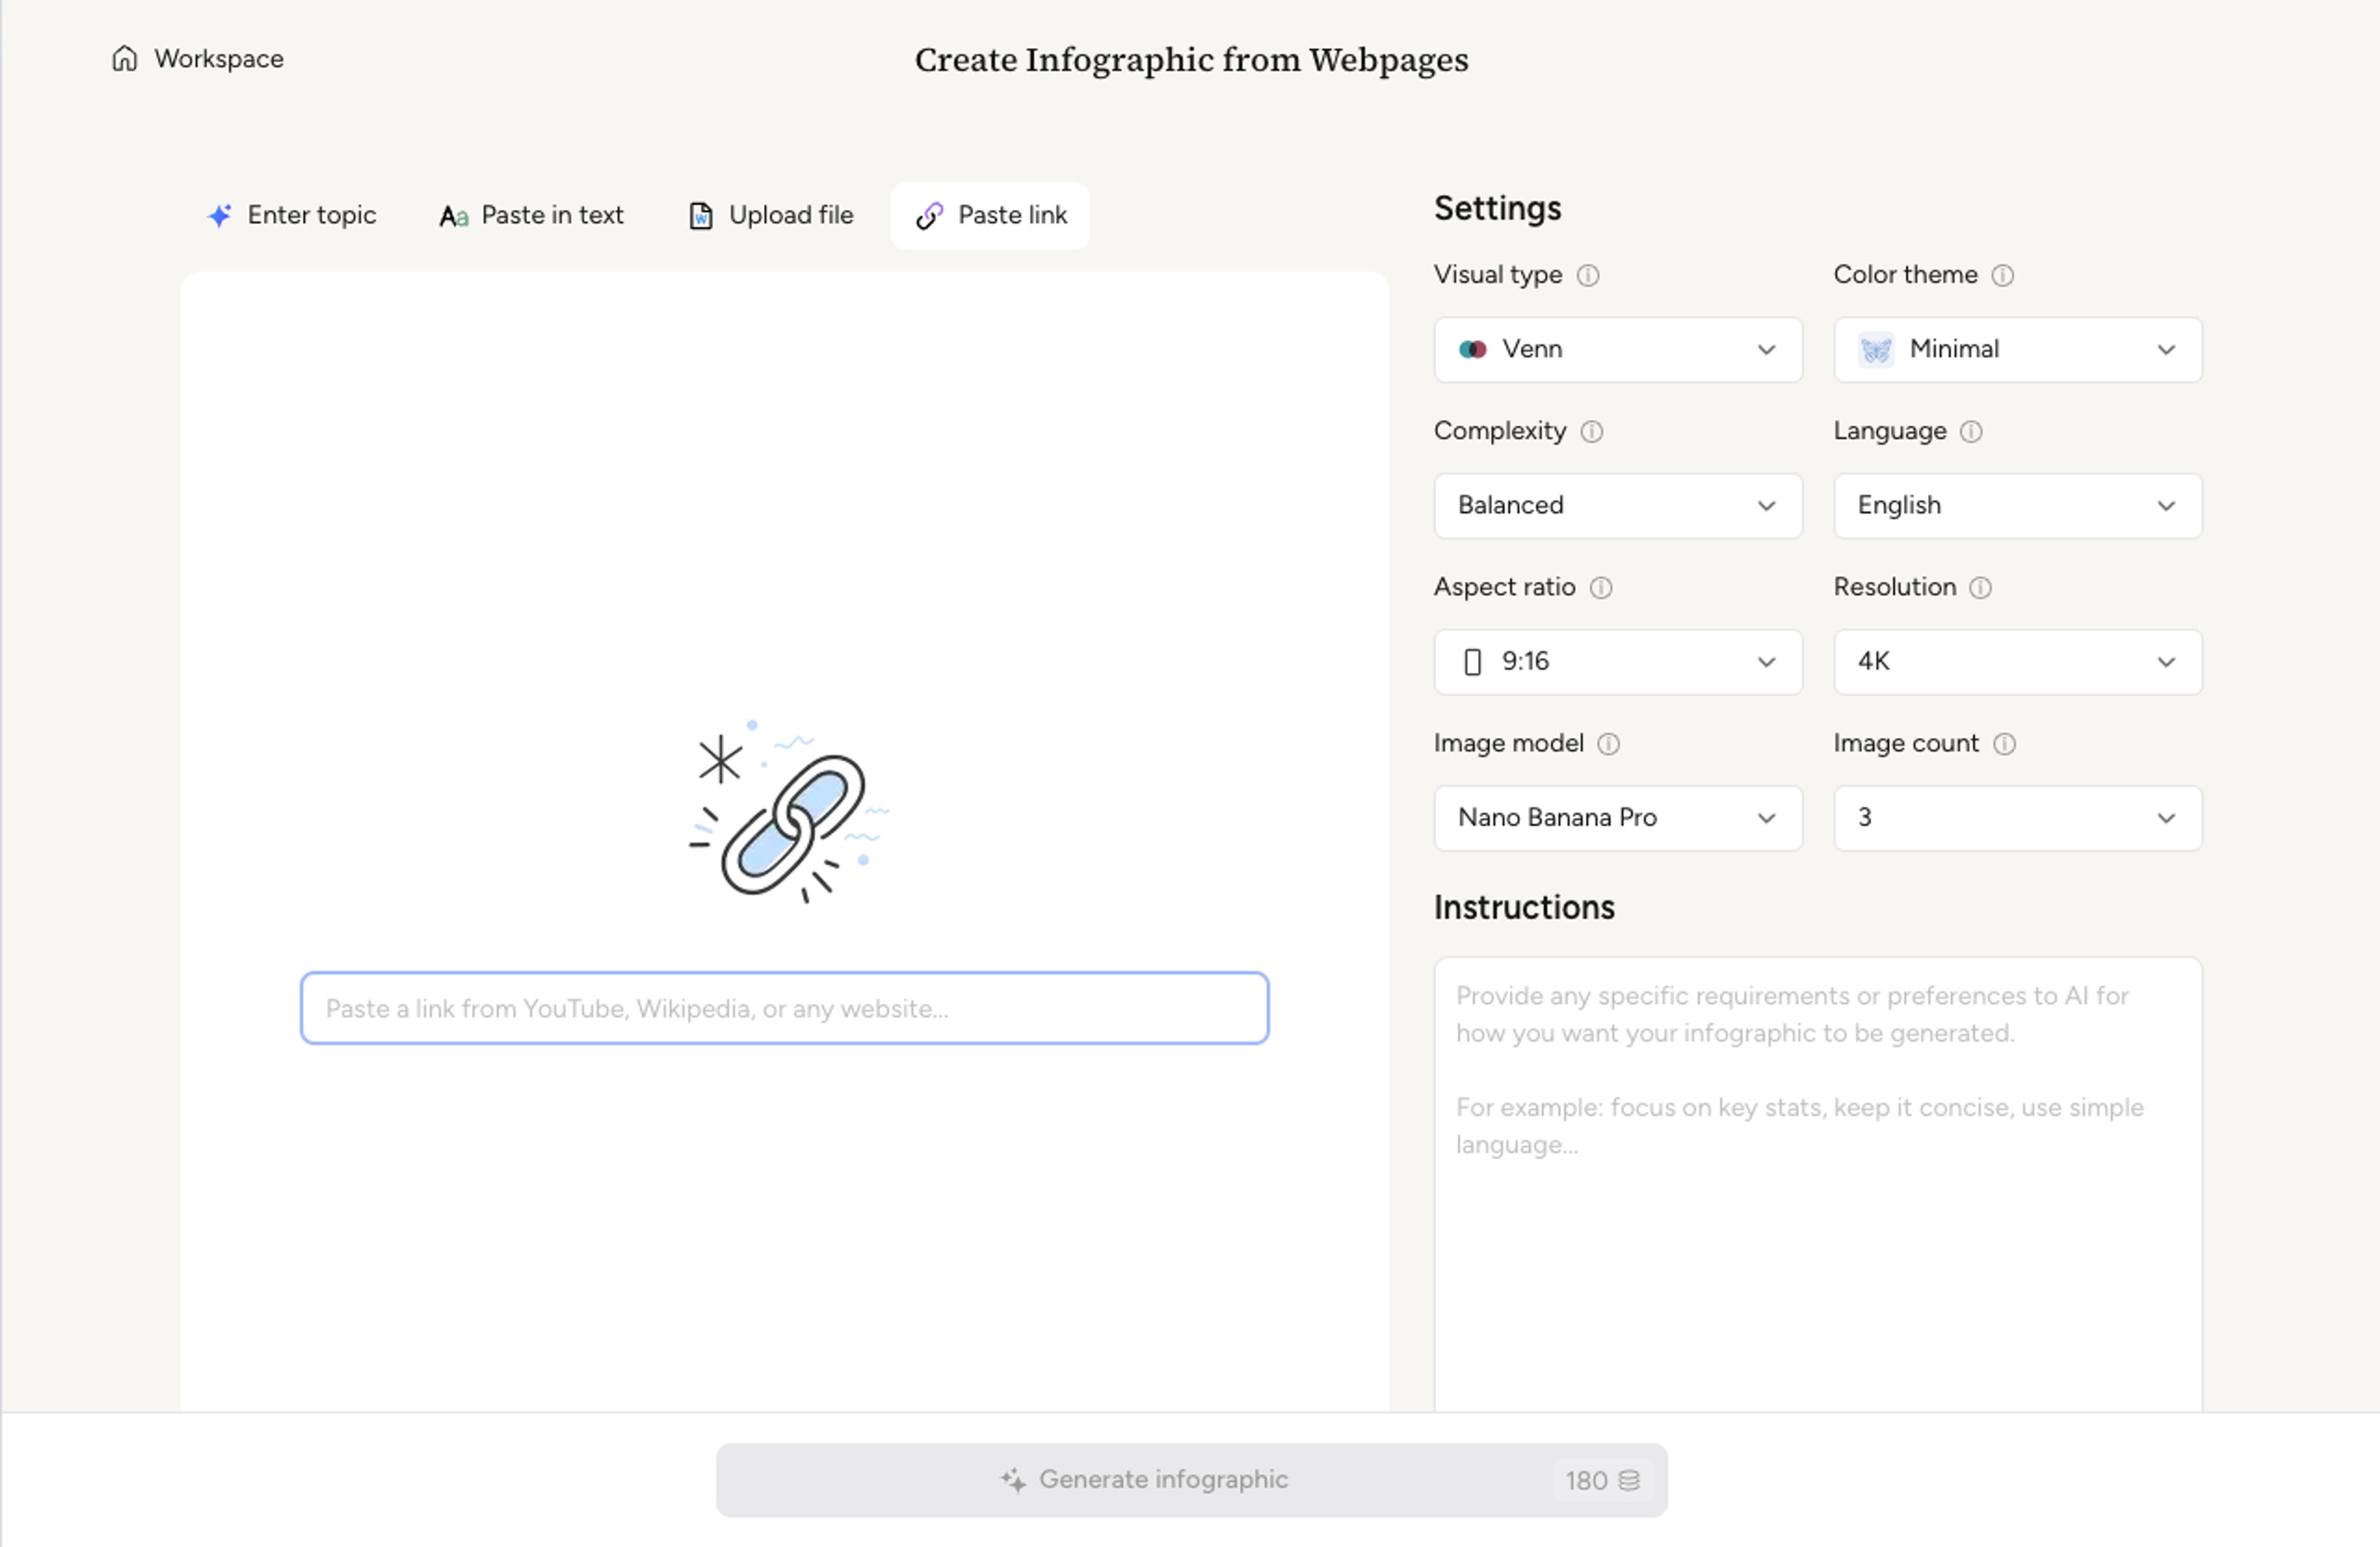
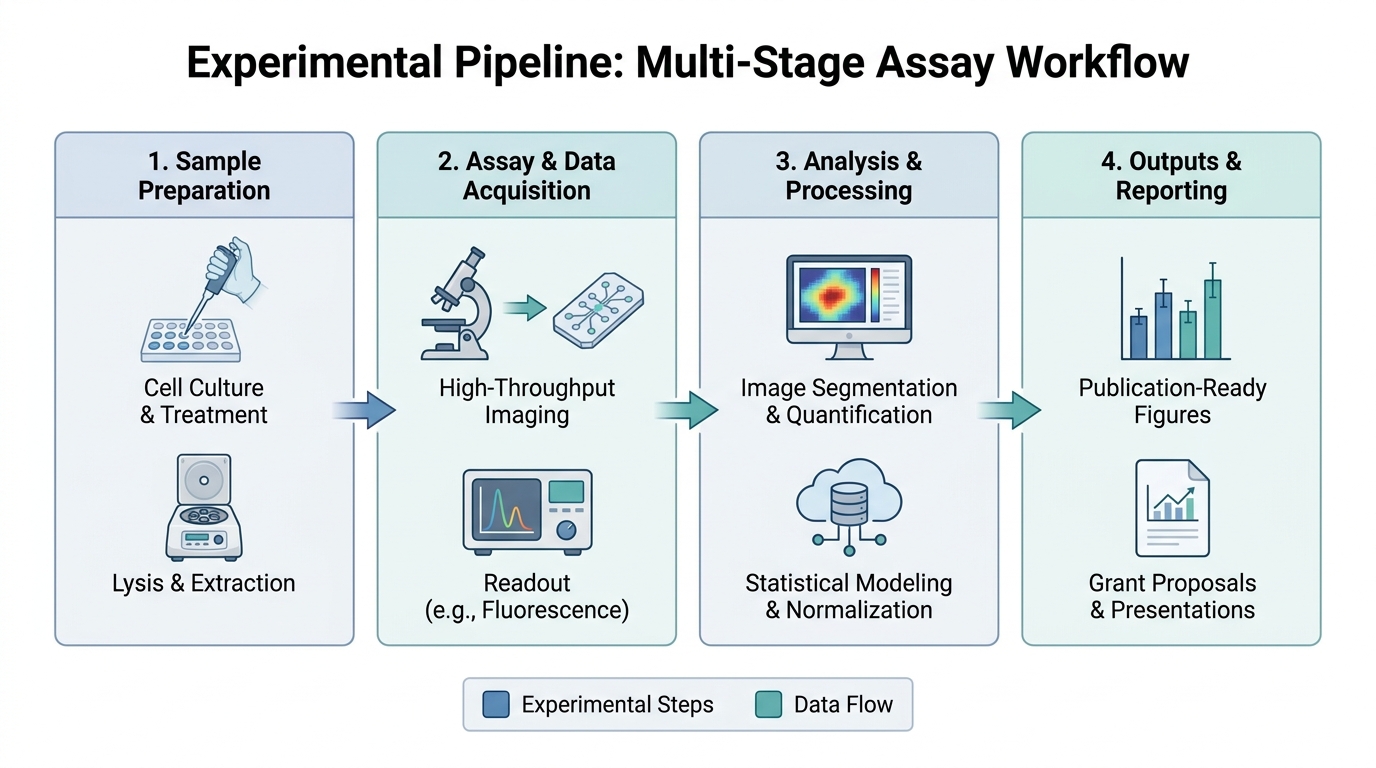
Ask for a figure, graphical abstract, method diagram, concept map, timeline, or classroom-friendly explanation.
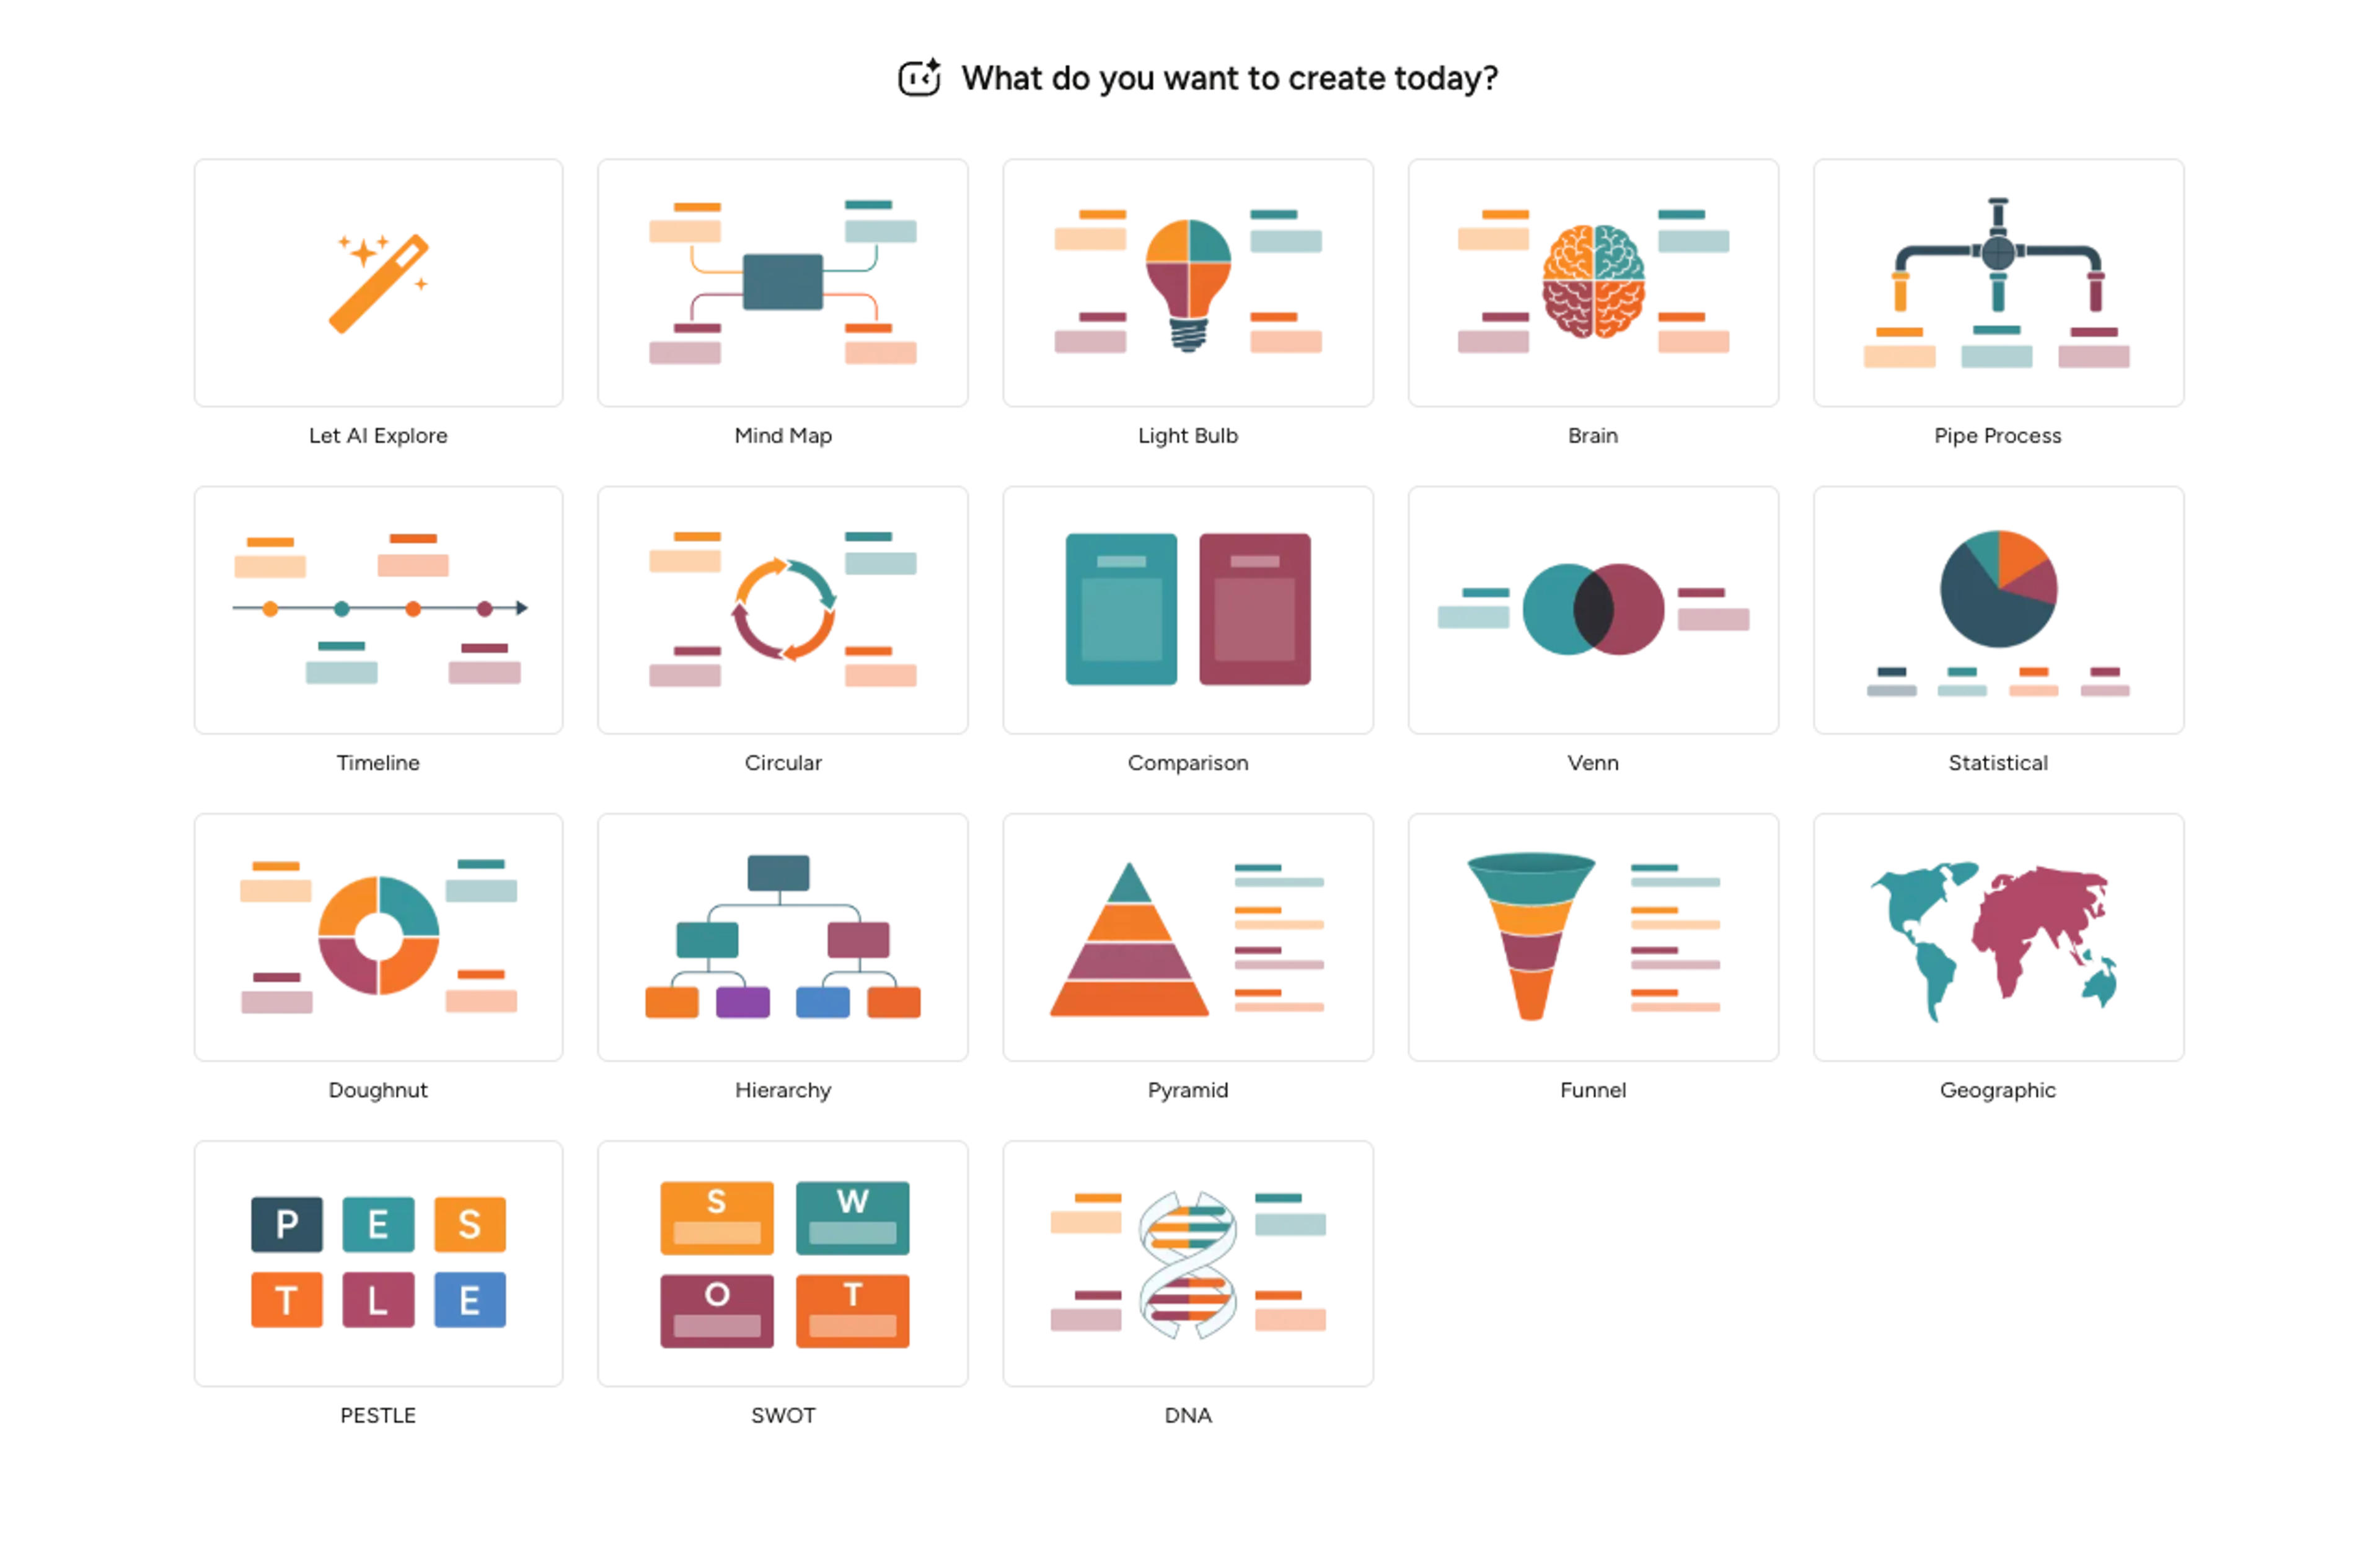
Infograph.me structures the source into labeled panels, captions, callouts, and readable visual hierarchy.
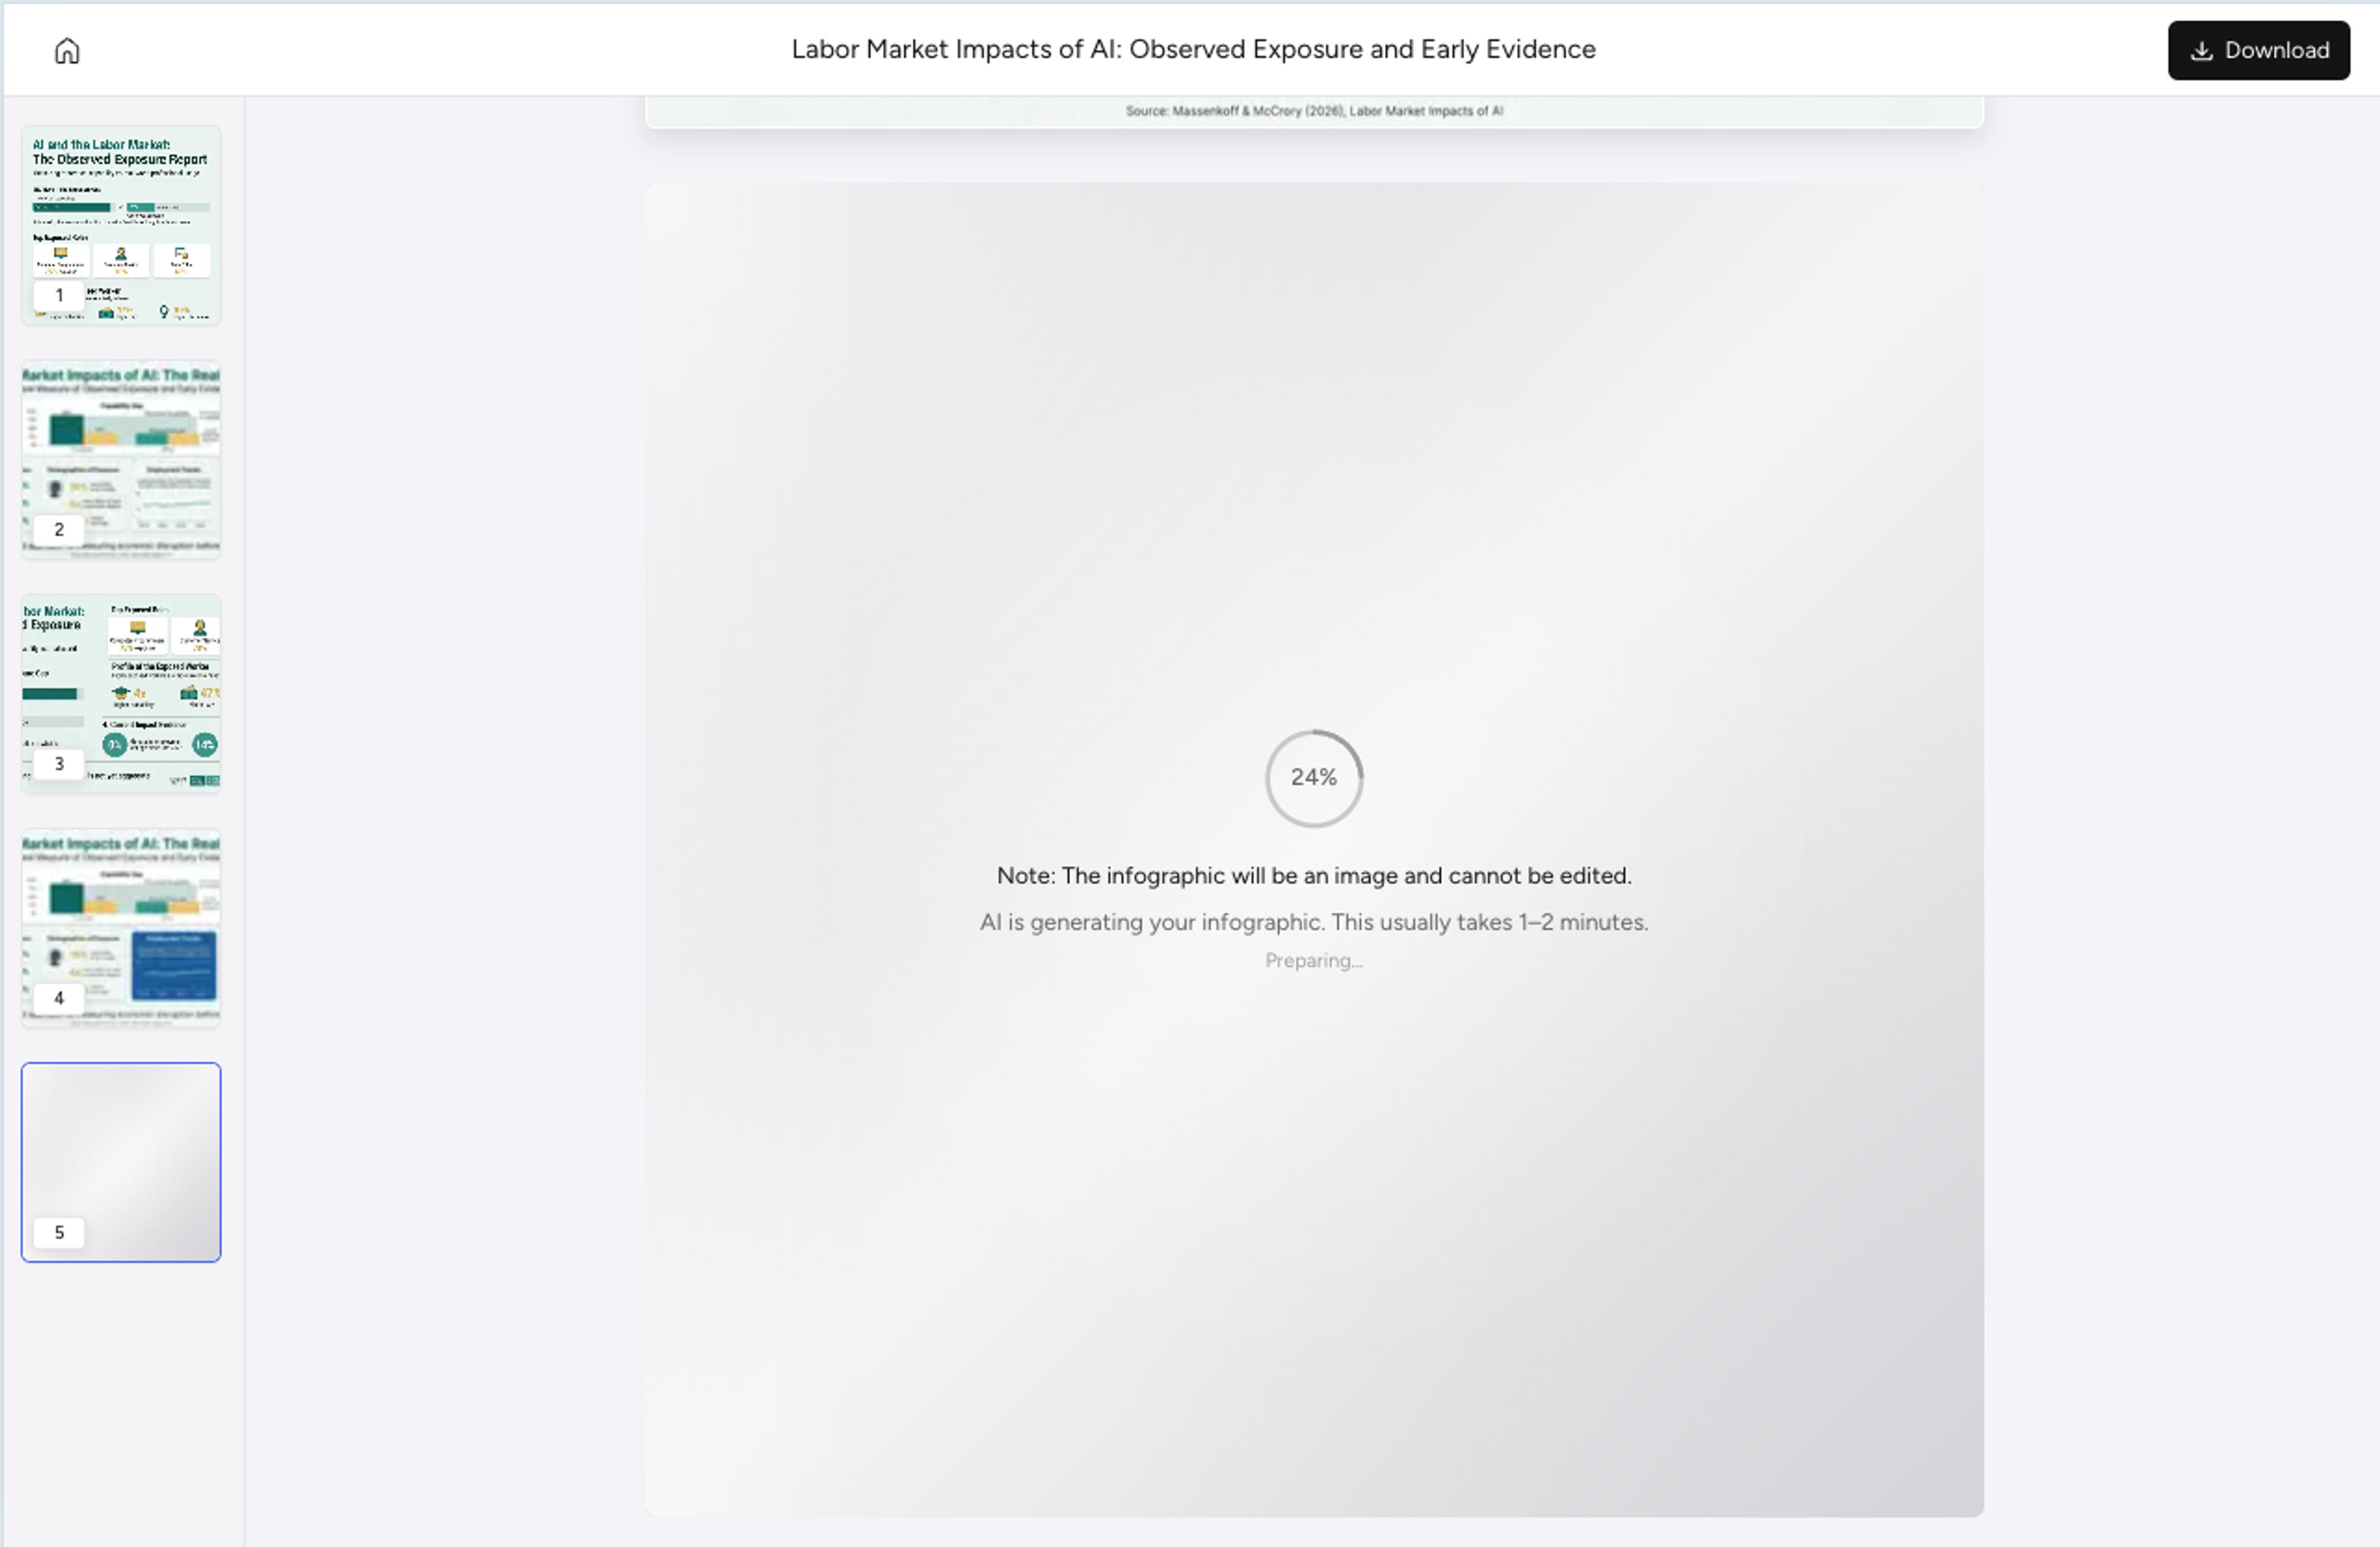
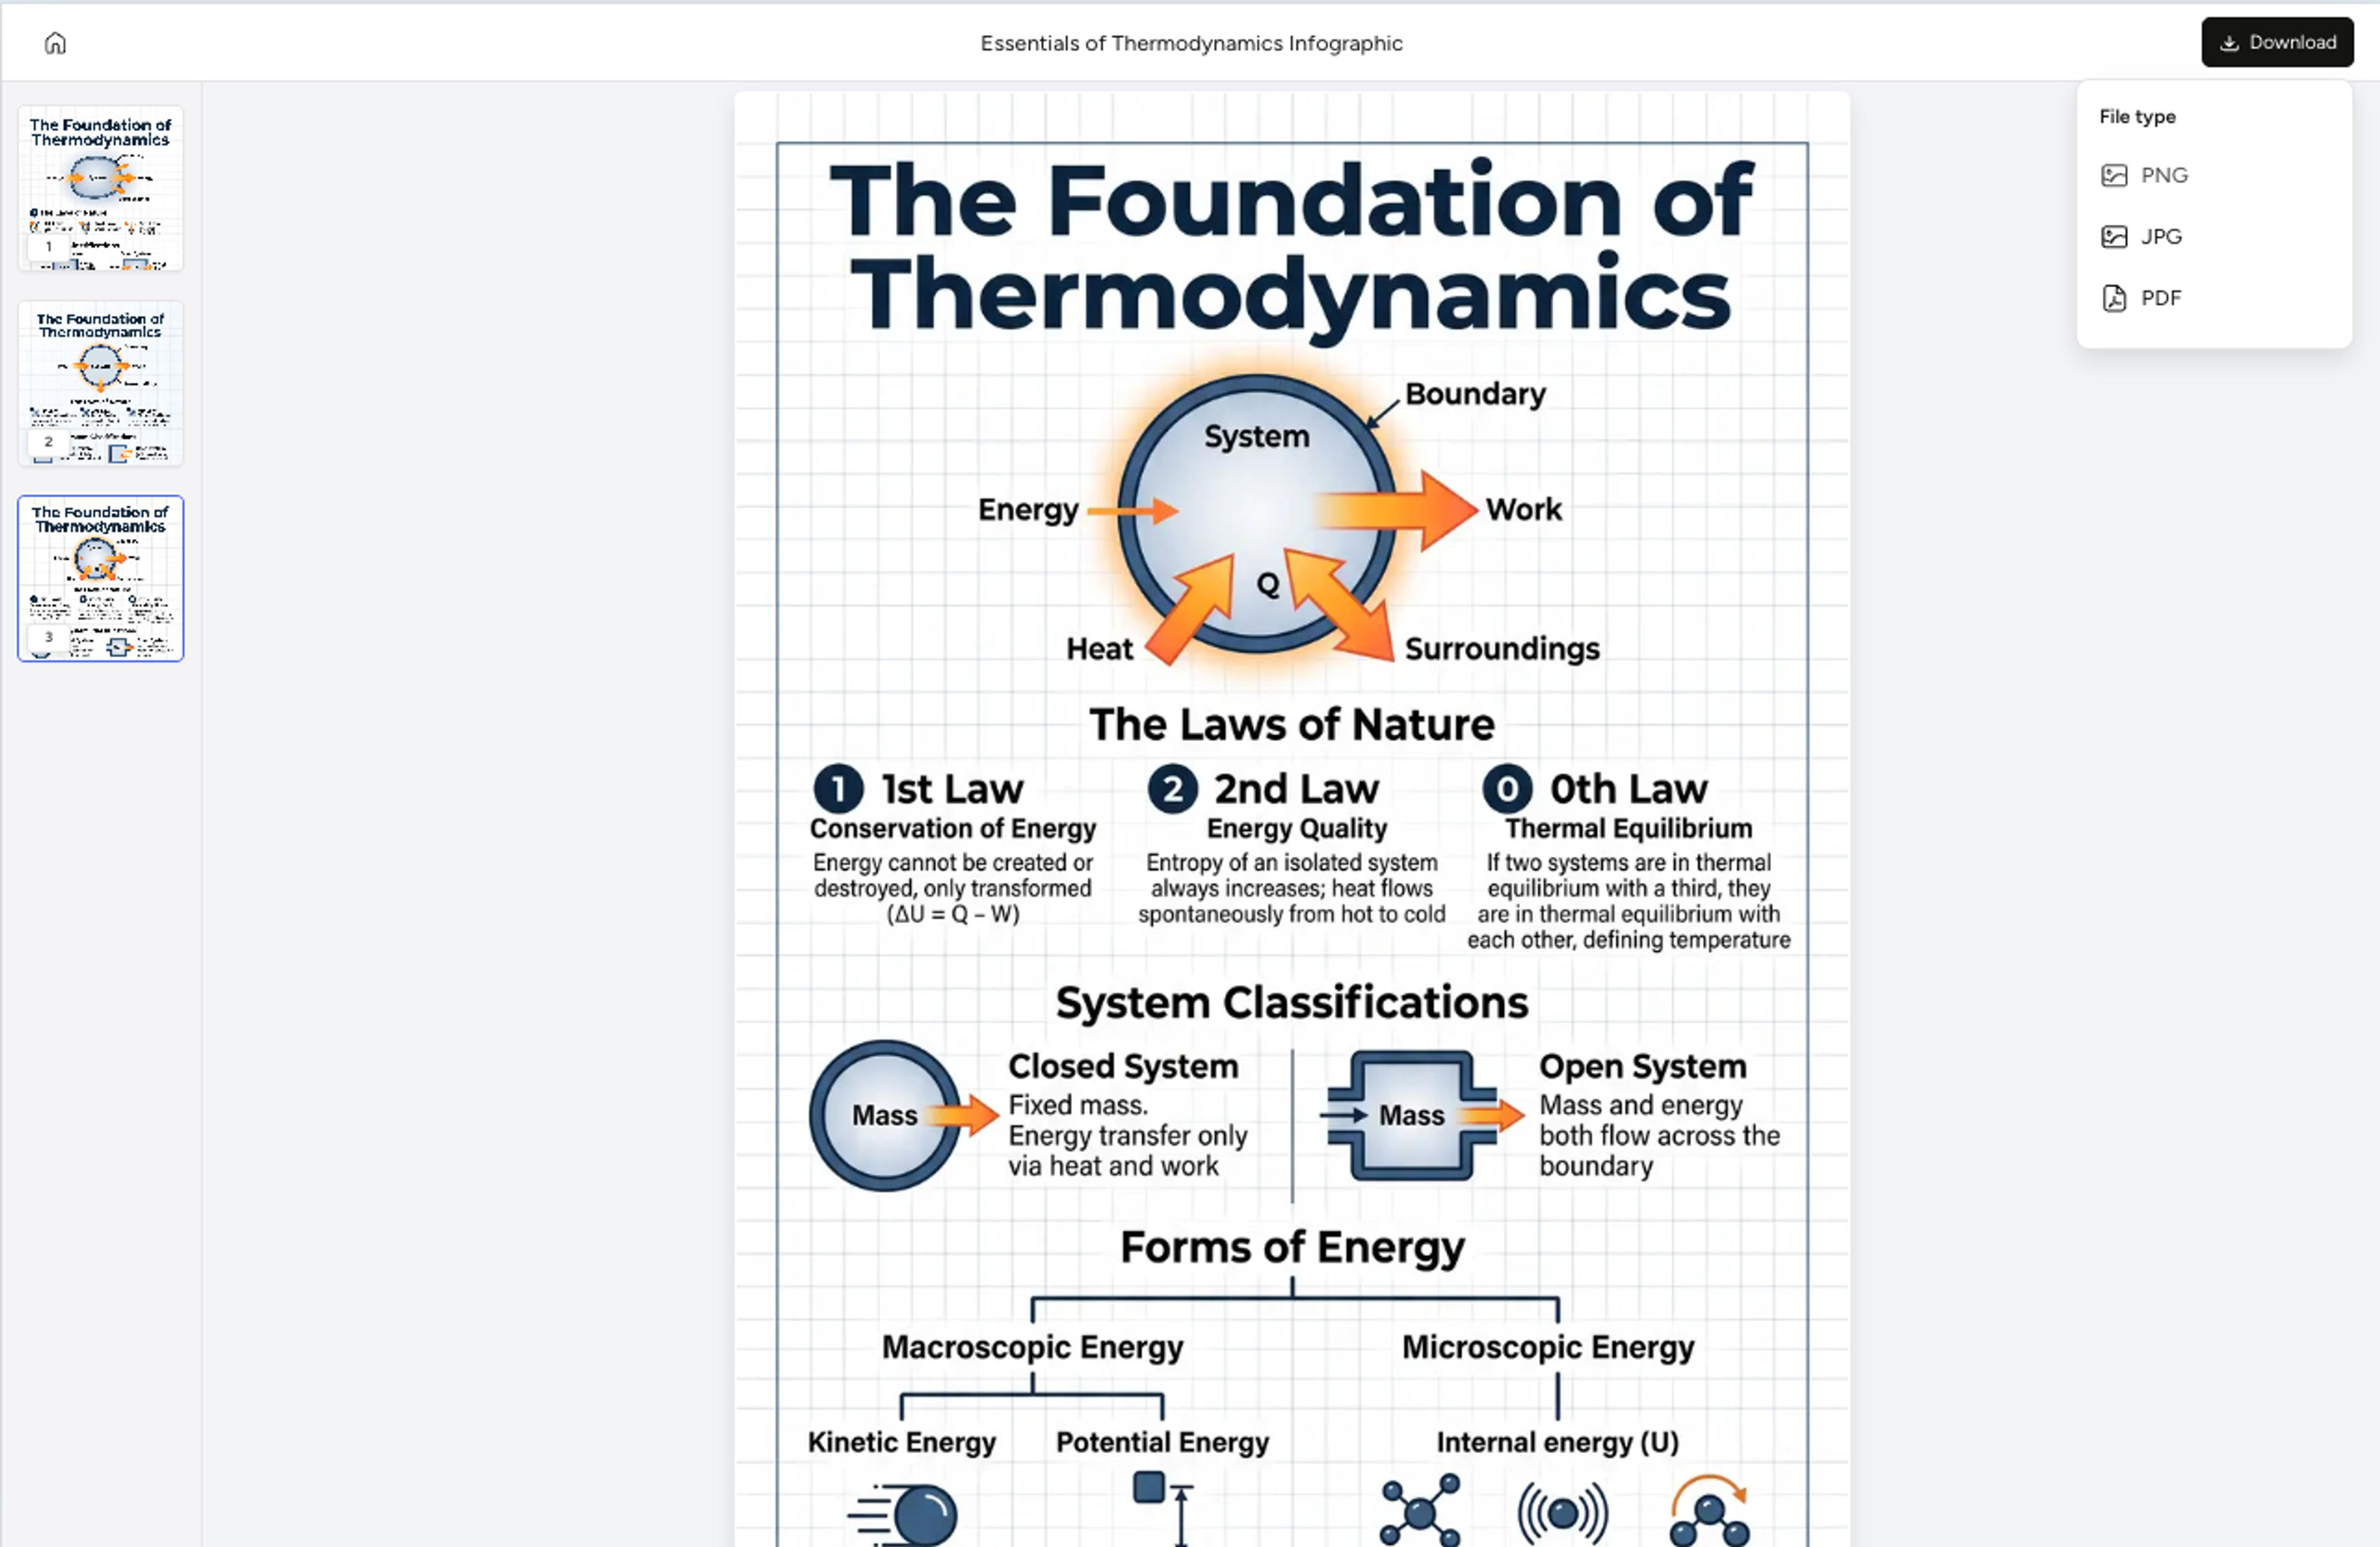
Use AI edits to improve labels, layout, and audience fit, then export the visual for your workflow.
Infograph.me focuses on readable scientific figures, research diagrams, classroom visuals, and academic communication.
Structure figures with clean panels, arrows, labels, and simple shapes.
Useful when journals, posters, or design tools require scalable assets.
Ideal for pathway diagrams, workflows, mechanisms, and concept maps.
Check labels and captions before exporting to any final production format.
Simplify crowded sections before moving to downstream editing.
Support figures that may appear in papers, decks, posters, or reports.
SVG is useful for scalable diagrams and downstream vector editing when a figure needs additional polish.
Pathways, workflows, concept diagrams, timelines, and labeled schematic figures are strong candidates.
No. Use the format that fits the final workflow. Raster exports are still useful for quick sharing and slides.
Yes. Use AI editing to simplify labels and structure before export.
Yes. Always confirm the journal or conference requirements for figure formats and resolution.
Continue with adjacent Infograph.me pages for scientific figures, source-to-visual workflows, editing, and export.
Turn research notes, methods, data, and science topics into labeled scientific figure drafts with AI.
Generate clear scientific illustrations, concept diagrams, and explanation visuals from text, papers, links, and topics.
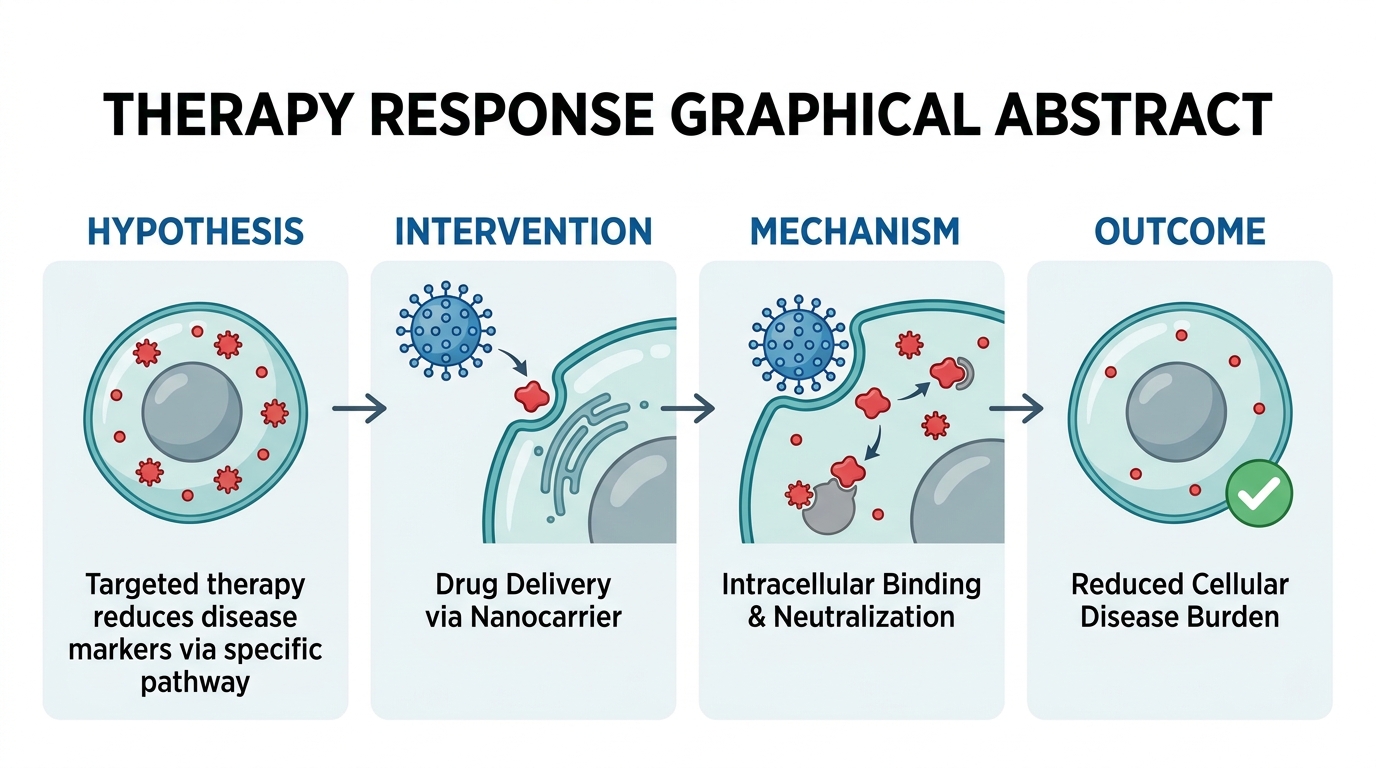
Create graphical abstract drafts from papers, abstracts, methods, findings, and research notes.
Turn research findings, methods, literature notes, and data into clear academic infographics.
Paste methods, abstracts, lesson text, or research notes and turn them into labeled scientific figure drafts.
Upload a paper, report, or lesson PDF and turn the source into a scientific figure, diagram, or graphical abstract draft.
Refine generated scientific figures with AI instructions for labels, layout, captions, hierarchy, and visual emphasis.
Prepare scientific figures for lectures, lab meetings, posters, and research presentations with editable slide workflows.