

Process dense materials
Turn lengthy biology chapters, medical journals, or lecture notes directly into structured visual layouts.
Use Infograph to transform biology texts, medical research, and lecture notes into a clear brain diagram instantly.
Drag and drop your document here or
Turn lengthy biology chapters, medical journals, or lecture notes directly into structured visual layouts.
Automatically organize cognitive theories, neural pathways, or anatomical labels into a readable brain diagram.
Easily refine labels, tweak colors, or restructure the diagram by typing simple commands instead of redrawing.
Upload your neuroscience research, paste a link to an article, or type your text into the tool.
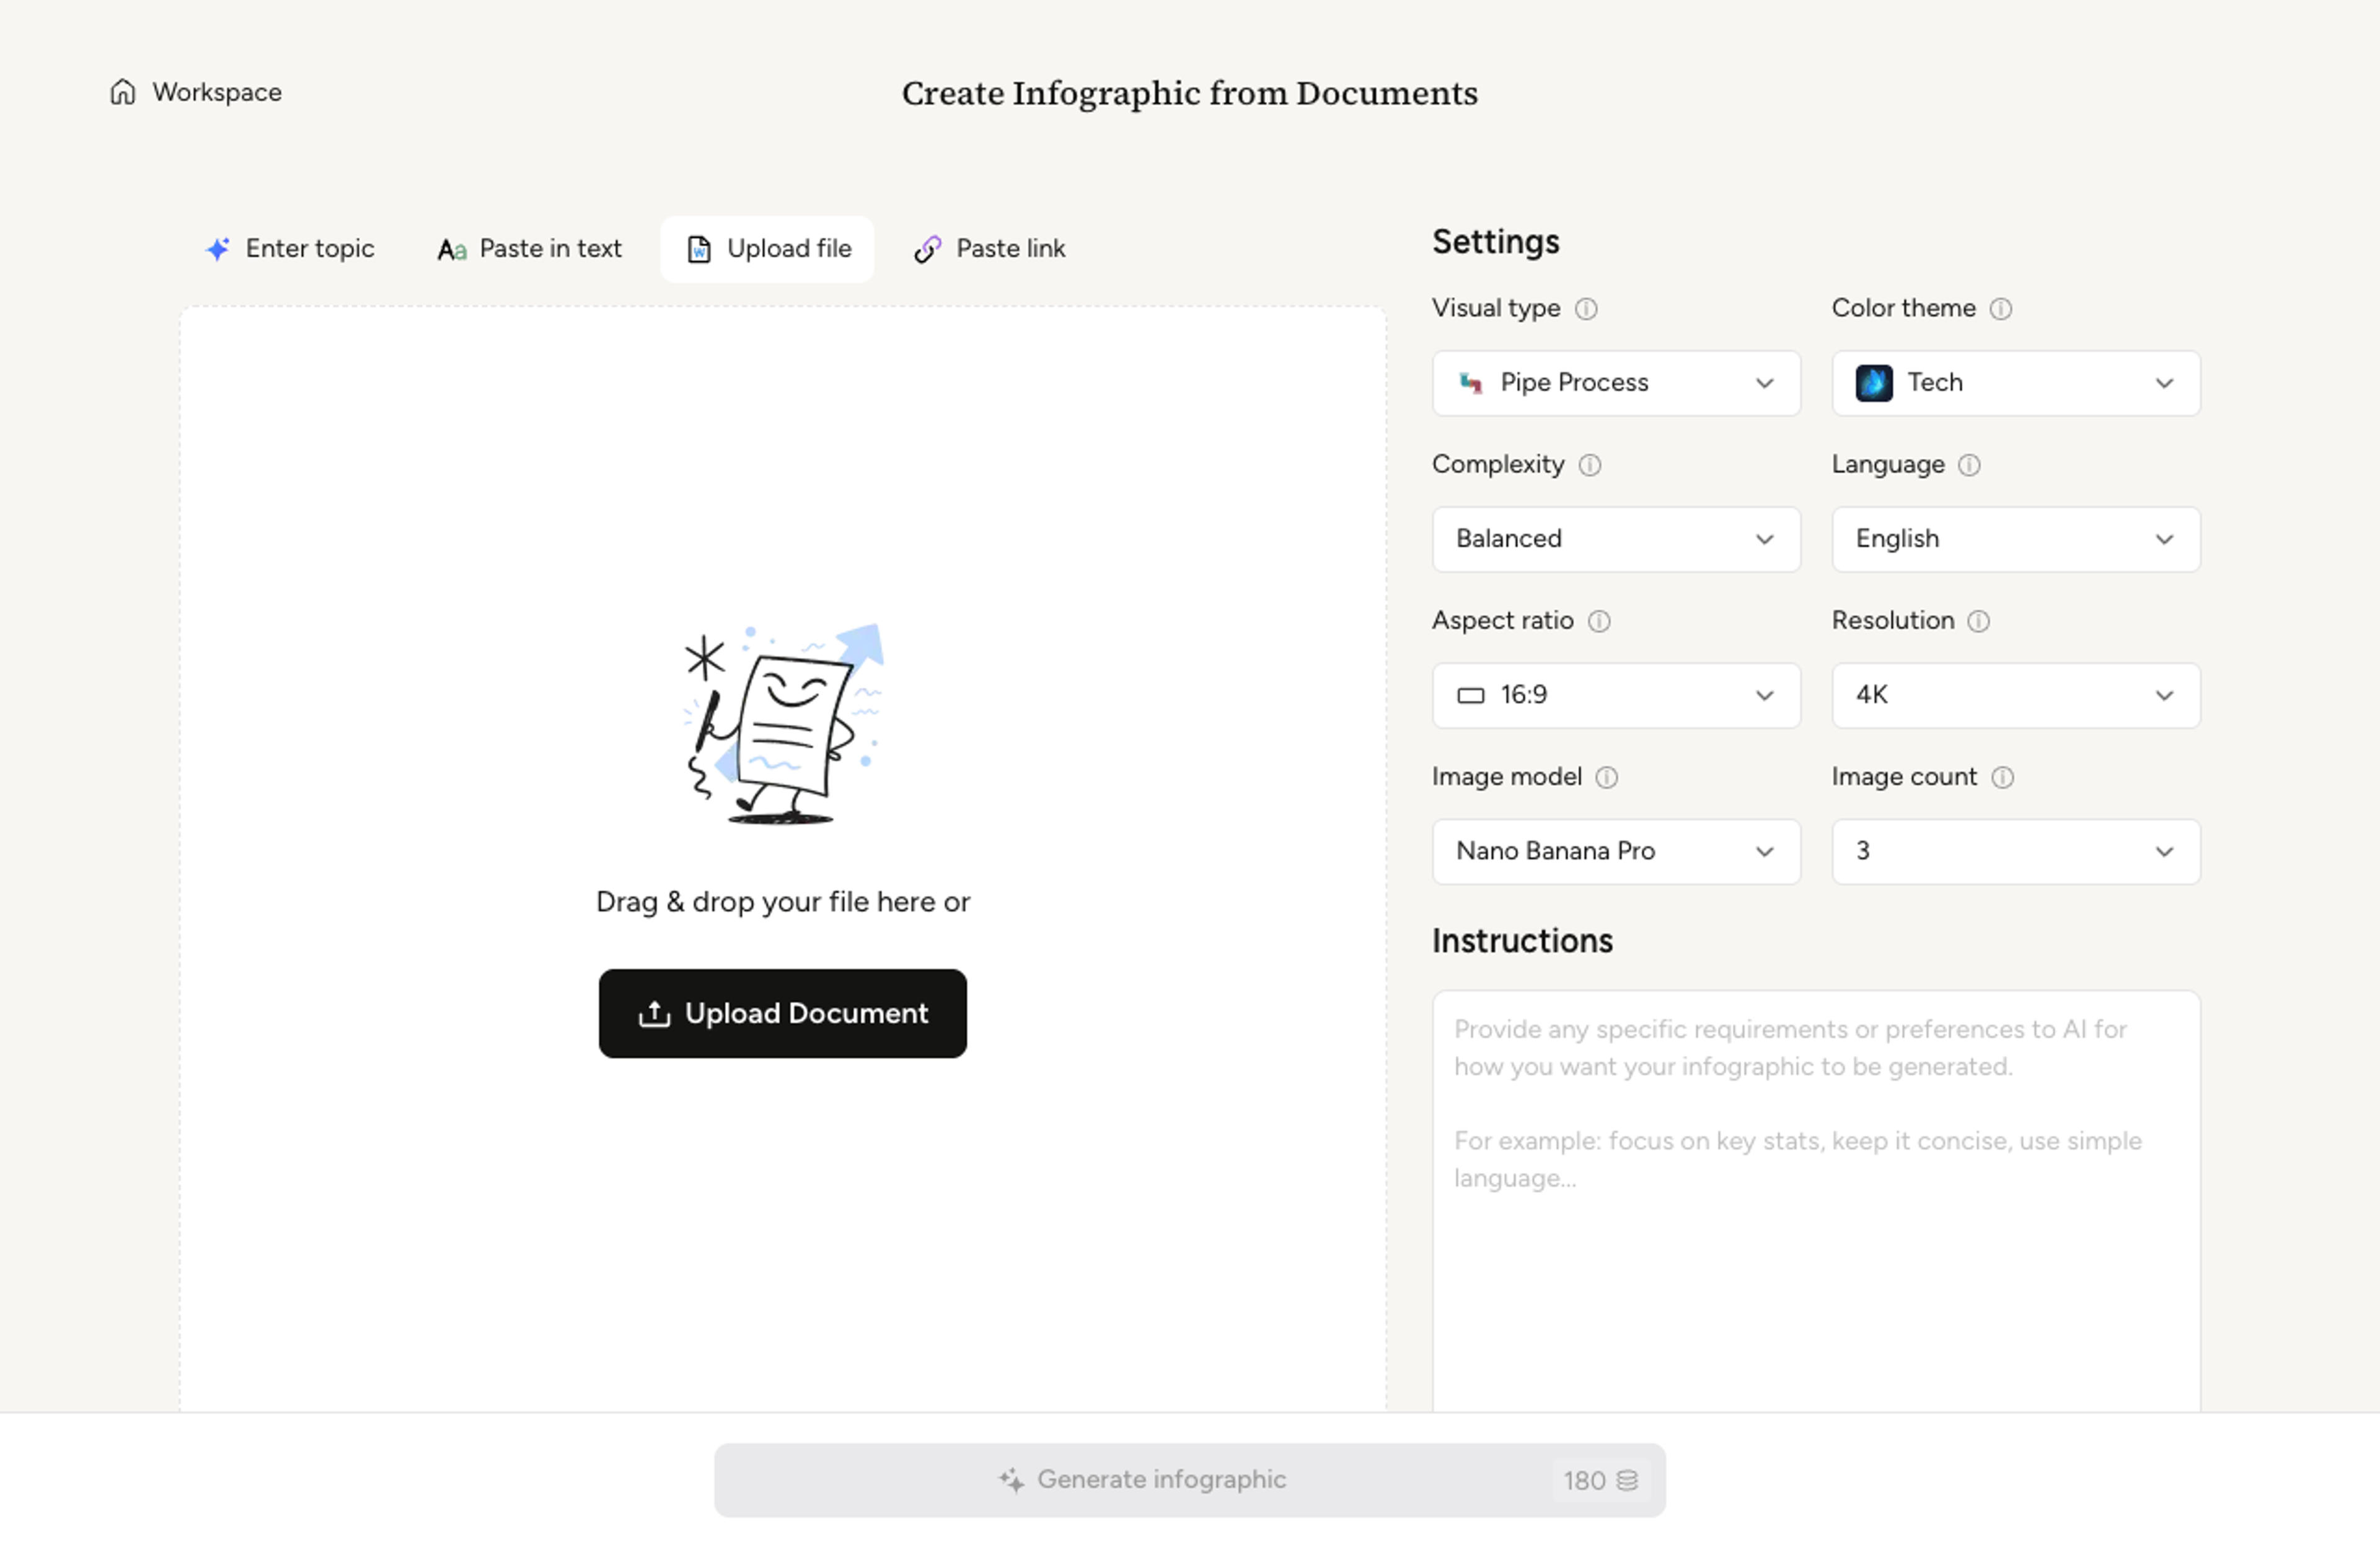
Select your preferred detail level and output settings for your scientific figure, then choose a professional visual theme that fits your academic or medical presentation needs.

The AI analyzes your text and generates a structured, easy-to-read brain diagram.

Review your diagram, make instant AI edits, and export it as a PNG, JPG, or PDF.

Yes. Upload your documents, paste a URL, or add existing text, and Infograph will convert your source material into a structured visual diagram.
The tool supports academic, scientific, and educational visual styles, so your diagram can be perfectly formatted for a research paper, a classroom slide, or a patient handout.
Yes. You can tell the AI exactly what to adjust, such as rewriting a label, changing the layout, or updating colors, and it applies the edit directly without starting from scratch.
Yes, you can start generating scientific figures and infographics for free, and upgrade when you need more advanced usage.
You can export your visual as a PNG, JPG, or PDF. That makes it easy to share online, add it to research reports, or insert it into PowerPoint presentations.
We prioritize safety and privacy. Your uploaded research documents, pasted text, and generated diagrams remain private unless you choose to share them.
Describe two or three sets and Infograph will lay out a clean venn diagram with intersections, labels, and short captions ready for slides.
Paste an article, transcript, or batch of notes and Infograph turns the text into a polished infographic with hierarchy, callouts, and chart treatments.
Drop in a strategy doc or a business brief and Infograph will fill a clean SWOT template with strengths, weaknesses, opportunities, and threats.
Turn raw datasets, survey results, or research findings into a multi-chart statistical infographic that reads top-to-bottom like a narrative.
Turn strategy memos, planning sessions, or release notes into a roadmap visual that reads cleanly in stakeholder reviews and quarterly updates.
Turn frameworks like Maslow, Bloom's, or your own strategy stack into a clean pyramid chart that orders priorities at a glance.
Drop in a P&ID description, technical spec, or system overview and Infograph composes a clean pipe process diagram with named units and flow direction.
Drop in a market brief or a strategy memo and Infograph will compose a clean PESTLE analysis covering political, economic, social, technological, legal, and environmental factors.
Drop in meeting transcripts, research notes, or a single topic and Infograph builds a clean radial mind map you can iterate on.
Frame an innovation brief, brainstorming notes, or a strategy memo as a clean light bulb infographic that lands the core idea in a single visual.
Turn documents, links, text, and data into editable infographics instantly. ⭐ AI Infographic Generator | Built for fast, high-quality visual storytelling